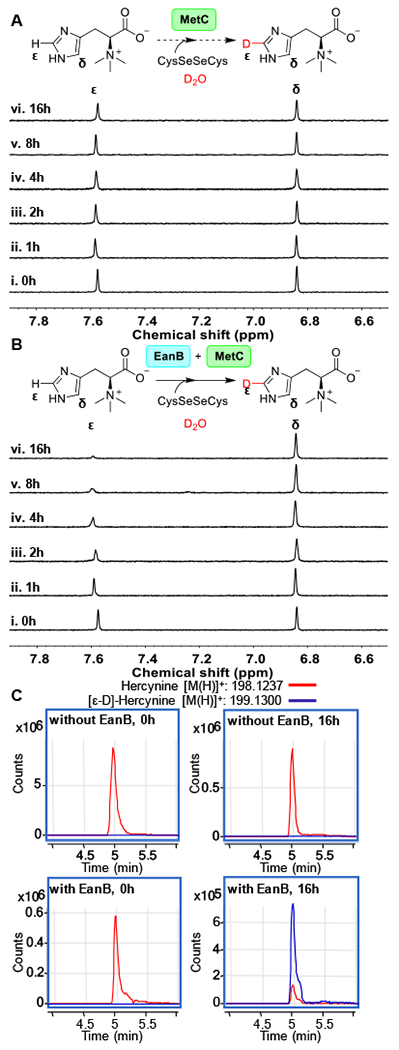
Figure 4. 1H-NMR analysis of hercynine’s imidazole side-chain ε-C-H bond deuterium exchange.

(A) 1H-NMR spectra over time for the reaction mixture containing 3 mM hercynine, selenocystine saturated solution, 0.5 μM MetC in 50 mM KPi buffer in D2O (pD = 8.22). (B) 1H-NMR spectra overtime for the reaction mixture containing 3 mM hercynine, selenocystine saturated solution, 0.5 μM MetC, and 50 μM of EanB in 50 mM KPi buffer in D2O (pD = 8.22); (C) The extracted LC-MS ion chromatograph of [ε-D]-hercynine and [ε-H] hercynine in the EanB-MetC coupled reaction mixture using selenocystine as the substrate in D2O buffer. The percentage of [ε-D]-hercynine is quantified based on the peak area between [ε-D]-hercynine (m/z: 199.1300) and hercynine (m/z: 198.1237) from the extracted ion chromatograph.
