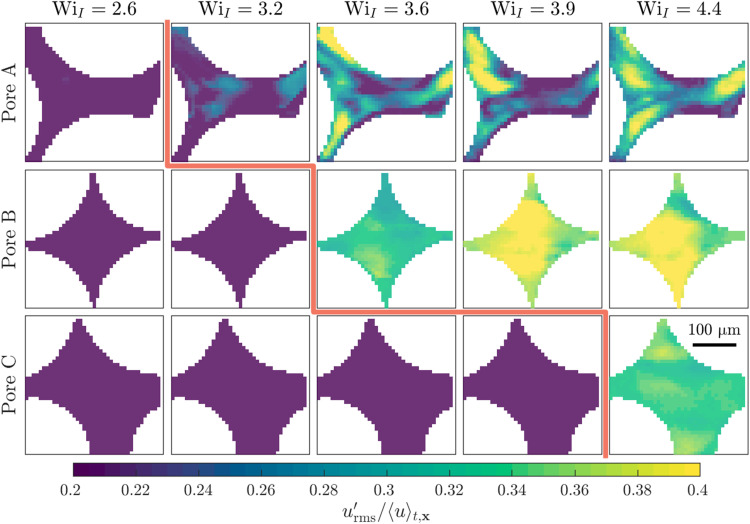
Fig. 3. The occurrence of elastic turbulence is spatially heterogeneous throughout a porous medium, reflecting porous individualism.
Images show the normalized magnitude of root mean square flow fluctuations over 60 min in different pores and at different flow rates, parameterized by WiI. Applied flow is left to right. Pore A becomes unstable at the lowest flow rate, as shown by the red line in the first row. Pore B becomes unstable at the next highest flow rate, shown by the red line in the second row. Pore C becomes unstable only at even higher flow rates.

