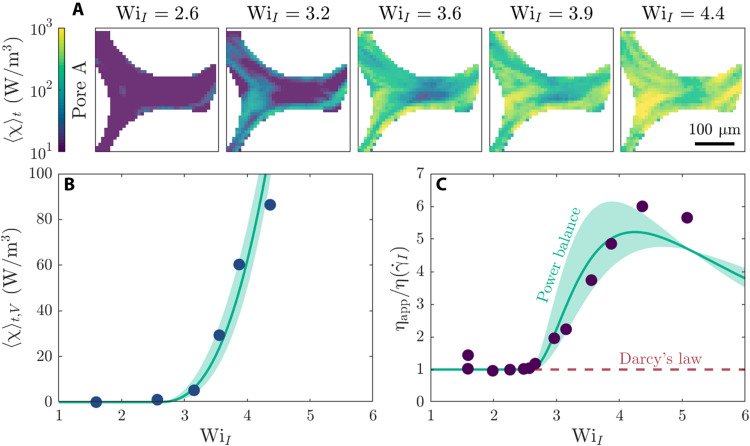
Fig. 4. Anomalous increase in macroscopic flow resistance is determined by the added viscous dissipation due to unstable flow fluctuations.
(A) The rate of added viscous dissipation 〈χ〉t directly measured from flow visualization for the example of pore A sharply increases above the onset of elastic turbulence. (B) Averaging the spatially averaged 〈χ〉t over all pores imaged yields the overall added viscous dissipation, which increases as a power law ∼(WiI/Wic − 1)2.6 above the macroscopic threshold Wic ≈ 2.6, as shown by the green curve. (C) The measured power-law fit to 〈χ〉t,V enables prediction of the macroscopic apparent viscosity ηapp via the power balance Eq. 3, as shown by the green curve and detailed in the Supplementary Materials; the uncertainty associated with the fit to 〈χ〉t,V [shaded region in (B)] yields an uncertainty in this prediction, as shown by the shaded region. Points indicate the independent measurements of ηapp from the macroscopic pressure drop.

