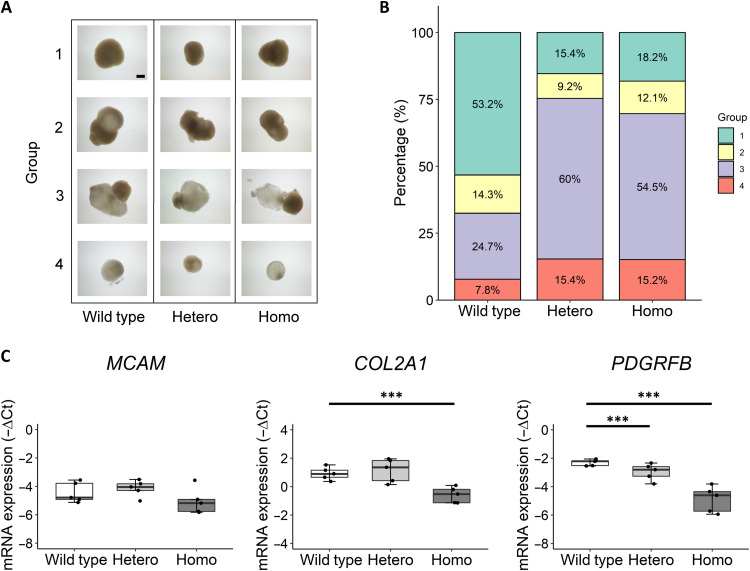
Fig. 3. Decreased chondrogenic potential of hiCPCs as a result of the FN1 mutation.
(A) Representative images of the observed morphology of wild-type, FN1 C518F heterozygous (Hetero), and C518F homozygous (Homo) hiCPC-derived chondrogenic pellets after 5 weeks of chondrogenesis in five independent differentiations. Pellets were categorized in four groups based on shape and opaqueness of the matrix: (1) round and dense, (2) protrusive and dense, (3) protrusive and transparent, and (4) round and transparent. Scale bar, 400 μm. (B) Distribution of pellets in groups 1 to 4 of wild-type (N = 77), FN1 heterozygous (N = 65), and FN1 homozygous pellets (N = 66) (N = 5 to 20 pellets per differentiation). (C) Gene expression levels depicted by −ΔCt values of hiCPC markers MCAM, COL2A1, and PDGFRβ (10) at day 0 of chondrogenesis of pooled wild-type and FN1 mutant hiCPCs (N = 5). The box plots represent 25th, 50th, and 75th percentiles, and whiskers extend up to 1.5 times the interquartile range. Individual samples are depicted by black dots in each graph. P values were determined by generalized estimation equations, with gene expression levels (−ΔCt) as dependent variable and genotype as factor. ***P < 0.001.

