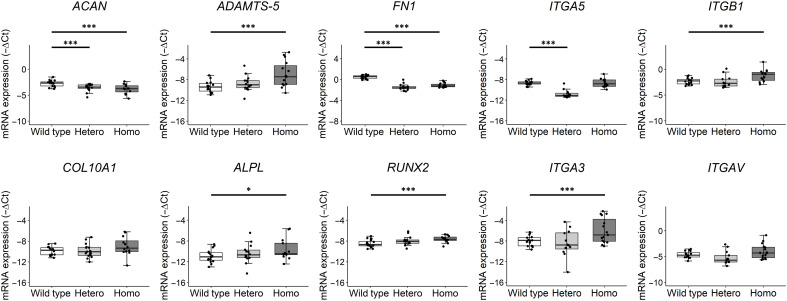
Fig. 6. FN1 mutation results in aberrant chondrocyte gene expression.
Box plots of −ΔCt values of ACAN, ADAMTS-5, FN1, ITGA5, ITGB1, COL10A1, ALPL, RUNX2, ITGA3, and ITGAV in wild-type and C518F FN1 heterozygous (Hetero) and homozygous (Homo) chondrogenic pellets. −ΔCt values shown were corrected for COL1A1 and COL2A1 expression levels to correct for the difference in efficiency of chondrogenic differentiation between genotypes. The box plots represent 25th, 50th, and 75th percentiles, and whiskers extend to 1.5 times the interquartile range. Individual samples are depicted by black dots in each graph. P values were determined by generalized estimation equations, with gene expression levels (−ΔCt) as dependent variable and genotype as factor. *P < 0.05 and ***P < 0.005

