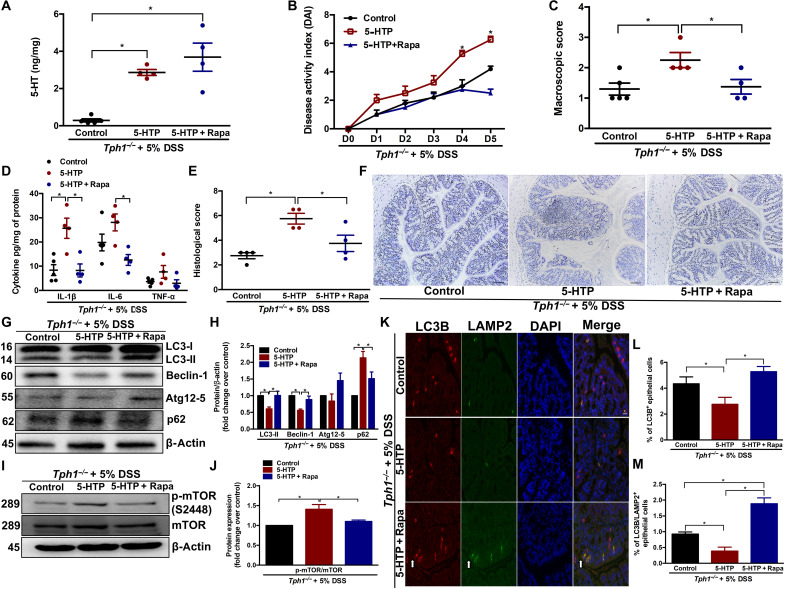
Fig. 2. Effect of 5-HTP and rapamycin treatment in Tph1−/− mice with DSS-induced colitis.
DSS (5%) was given to Tph1−/− mice in drinking water for 5 days to induce colitis along with 5-HTP (50 mg/kg twice a day), 5-HTP + rapamycin (1.5 mg/kg once a day), or vehicle treatment. Each group contained four to five mice. (A) Colonic 5-HT levels. (B) DAI. *P < 0.05 between control and 5-HTP as well as between 5-HTP and 5-HTP + Rapa (rapamycin) on days 4 and 5. (C) Macroscopic damage score on day 5 after DSS. Colon tissue was collected to determine (D) IL-1β, IL-6, and TNF-α; (E) histological score; and (F) representative micrographs on day 5 after DSS. Scale bars, 100 μm. (G) Western blot images and (H) quantification of autophagy proteins LC3, Beclin-1, Atg12-5, and p62. (I) Western blot images and (J) quantification of p-mTOR (S2448). Representative Western blot with β-actin as loading controls. Blots are representative of three to four random mice in each group. (K) Representative micrograph. Arrows indicate LC3B, LAMP2, and double-stained IECs. Scale bar, 100 μm. (L) Percentage of LC3B+ and (M) percentage of LC3B/LAMP2+ double-stained IECs in colonic sections. Data are represented as means ± SEM. *P < 0.05 for graphs (A), (C), (D), (E), (H), (J), (L), and (M).

