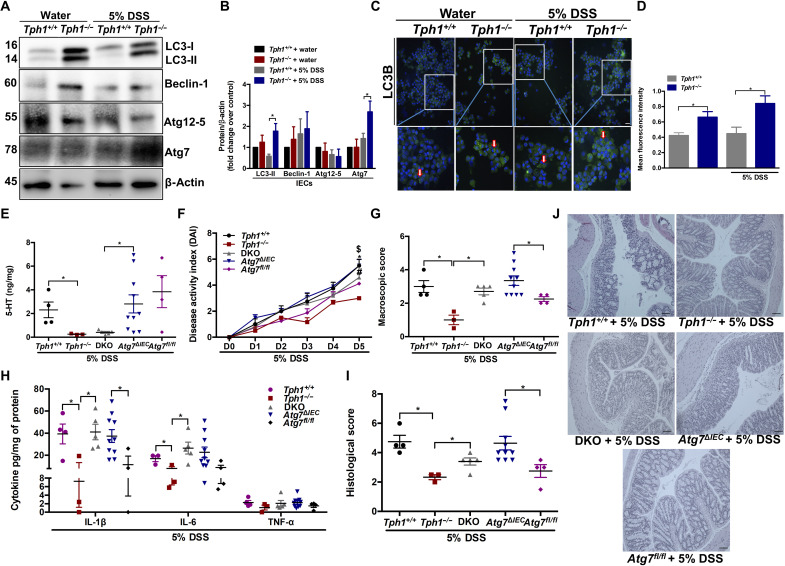
Fig. 4. Impact of 5-HT on autophagy in IECs and the effects of impaired IEC 5-HT–autophagy axis on colitis.
DSS (5%) was given to Tph1+/+ and Tph1−/− mice in drinking water for 5 days to induce colitis. Control groups received autoclaved drinking water. Each group contained three to four mice. IECs were isolated from the colon. (A) Western blot images and (B) quantification of autophagy proteins LC3, Beclin-1, Atg12-5, and Atg7 in the IECs. Representative Western blot with β-actin as loading controls. Data are representative of three to four random mice in each group. (C) Representative micrograph. Arrows indicate LC3B+ puncta in the IECs. Scale bar, 100 μm. (D) Mean fluorescence intensity of LC3B staining in isolated IECs. DSS (5%) was given to Tph1+/+, Tph1−/−, DKO, Atg7ΔIEC, and Atg7fl/fl mice in drinking water for 5 days to induce colitis. Each group contained 3 to 10 mice. (E) Colonic 5-HT amount. (F) DAI. $P < 0.05 between Tph1+/+ and Tph1−/−, *P < 0.05 between Atg7ΔIEC and Atg7fl/fl, and #P < 0.05 between DKO and Tph1−/−. (G) Macroscopic damage score on day 5 after DSS. Colon tissue was collected to determine (H) IL-1β, IL-6, and TNF-α; (I) histological score; and (J) representative micrographs on day 5 after DSS. Scale bars, 100 μm. Data are represented as means ± SEM. *P < 0.05 for graphs (B), (D), (E), (G), (H), and (I).

