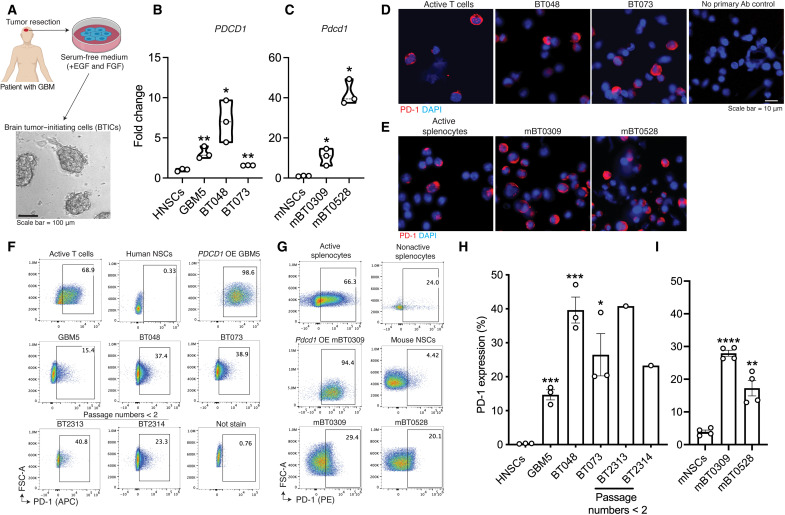
Fig. 2. The expression of PD-1 by patient-derived or murine BTICs in culture.
(A) Following surgery of patients with GBM, BTICs were generated from resected specimens by culturing cells in a serum-free medium supplemented with EGF and FGF. RT-qPCR analysis of PD-1 transcripts in (B) human (PDCD1) or (C) mouse (Pdcd1) BTIC lines compared with neural stem cells (NSCs). Fold changes were calculated relative to PD-1 expression in neural stem cells and normalized to GAPDH expression. Immunofluorescence of PD-1 staining on (D) human and (E) mouse BTIC lines in culture. Active T cells or splenocytes were used as controls. Nuclei were counterstained with DAPI. Representative flow cytometry plots of PD-1 expression on (F) human and (G) mouse BTIC lines, with quantitation and comparison to human or mouse neural stem cells shown in (H) and (I), respectively. Human or mouse BTICs (OE) PDCD1 or Pdcd1 and active T cells or splenocytes were used as controls. T cells or splenocytes were activated with anti-CD3/CD28 antibodies. Recently initiated patient-derived BTICs from two resections (BT2313 and BT2314), with less than two passages in culture, were also tested. Human and mouse cells were stained with antibodies conjugated with allophycocyanin (APC) or phycoerythrin (PE) fluorochromes, respectively. Data are representative of two to three independent experiments. Means were compared to neural stem cells with unpaired (two-tailed) t test, *P < 0.05, **P < 0.01, ***P < 0.001, and ****P < 0.0001. Data are represented as means ± SEM. See also figs. S2 and S3 and table S2. Ab, antibody.

