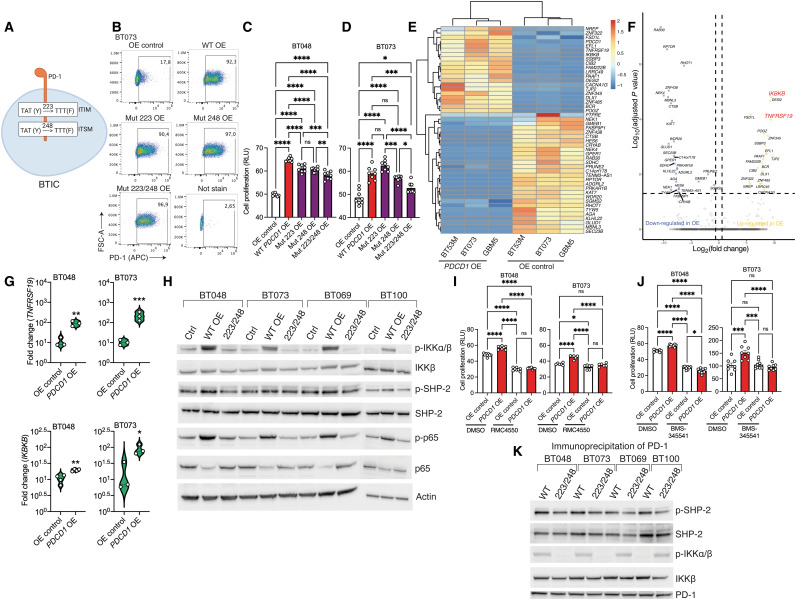
Fig. 4. PD-1 as a signaling receptor activates NFκB transcription factor in BTICs.
(A) Schematic diagram of site-directed mutagenesis in two signaling motifs (ITIM, Y223F; ITSM, Y248F) of human PD-1 gene. (B) Representative flow cytometry plots of PD-1 expression in BT073 transfected with OE vectors coding wild-type (WT), 223, 248, or 223/248 mutant (Mut) version of PD-1. (C and D) ATP proliferation assay of human BT048 and BT073 cells OE wild-type or mutant versions of PD-1 compared with OE control. ns, not significant. (E) Heatmap of differentially expressed genes between PDCD1–OE cells and OE control of three human BTIC lines. Experiment was conducted once. (F) Volcano plot shows all data points that meet the false discovery rate (FDR) cutoff of 5% and 1.5-fold change criteria. (G) Validation of mRNA expression of TNFRSF19 and IKBKB genes by RT-qPCR in another culture set of BT048 and BT073 cells. Fold changes were calculated relative to PD-1 expression in OE control and normalized to GAPDH expression. (H) The phosphorylation of IKKα/β, SHP-2, and NFκB (p65) was detected in the cell lysates of four human BTIC lines by Western blot. Actin was used as a loading control. Luminescence ATP proliferation test of PDCD1-OE BT048 and BT073 cells compared to OE controls after 72 hours of treatment with (I) SHP-2 inhibitor RMC4550 (3 Mμ) or (J) IKKα/β inhibitor BMS-345541 (1 Mμ). DMSO, dimethyl sulfoxide. (K) After PD-1 immunoprecipitation of cell lysates and SDS–polyacrylamide gel electrophoresis, immunoblot was performed with antibodies for p–SHP-2, SHP-2, p-IKKα/β, IKKβ, and PD-1. Means were compared by unpaired (two-tailed) t test when comparing two groups. For more than two groups, one-way ANOVA with Tukey’s post hoc was used: *P < 0.05, **P < 0.01, ***P < 0.001, and ****P < 0.0001. Data are represented as means ± SEM. See also fig. S5.

