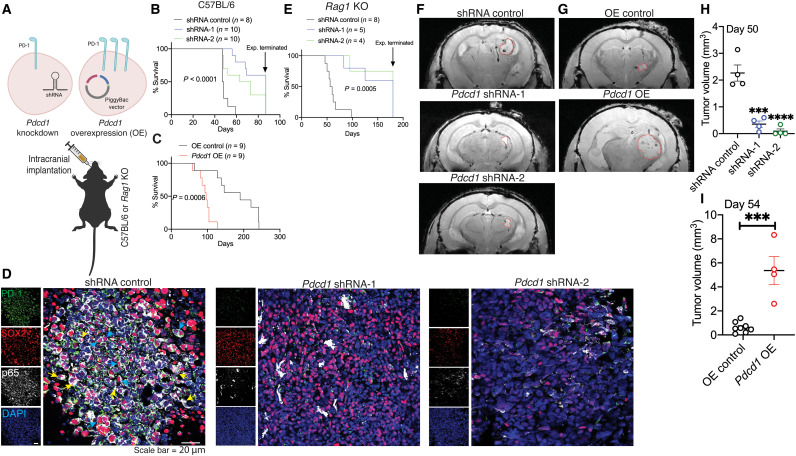
Fig. 7. PD-1 on BTICs promotes intracranial tumor growth in mice.
(A) Schematic diagram depicts implantation of Pdcd1-knockdown or OE cells into the striatum of mice. Kaplan-Meier analysis to assess the survival of wild-type mice i4mplanted with (B) Pdcd1 knockdown or (C) overexpressing murine BT0309. Cells transduced with lentiviral vectors coding nontarget shRNA or transfected with empty PiggyBac vector were considered as controls for knockdown (shRNA control) or OE (OE control) BTICs, respectively. (D) Representative images of immunofluorescence staining of PD-1, SOX2, and p65 in sections collected from C57BL/6 wild-type mice implanted with Pdcd1-knockdown or shRNA controls. Nuclear translocation (yellow arrowheads) and cytoplasmic localization (blue arrowheads) of p65 in BTICs are shown on the images. (E) Kaplan-Meier analysis of Rag1 KO mice implanted with Pdcd1-knockdown or shRNA controls of mBT0309. Representative T2-weighted MRI images (F) at day 50 of Rag1 KO mice implanted with Pdcd1-knockdown or (G) at day 54 of Rag1 KO mice implanted with Pdcd1 OE mBT0309 (tumor demarcated with red outlines). Quantitation of tumor volume from MRI images of mice implanted with (H) Pdcd1 knockdown or (I) OE BTICs versus respective vector controls. Results are representative of n = 2 to 3 independent experiments. Unpaired (two-tailed) t test was used to assess significance between two groups in (I). For more than two groups in (H), one-way ANOVA with Tukey’s post hoc was used. Kaplan-Meier survival curves were analyzed for statistical differences between groups using the log-rank Mantel-Cox test: ***P < 0.001 and ****P < 0.0001 compared to respective vector control. Data are represented as means ± SEM.

