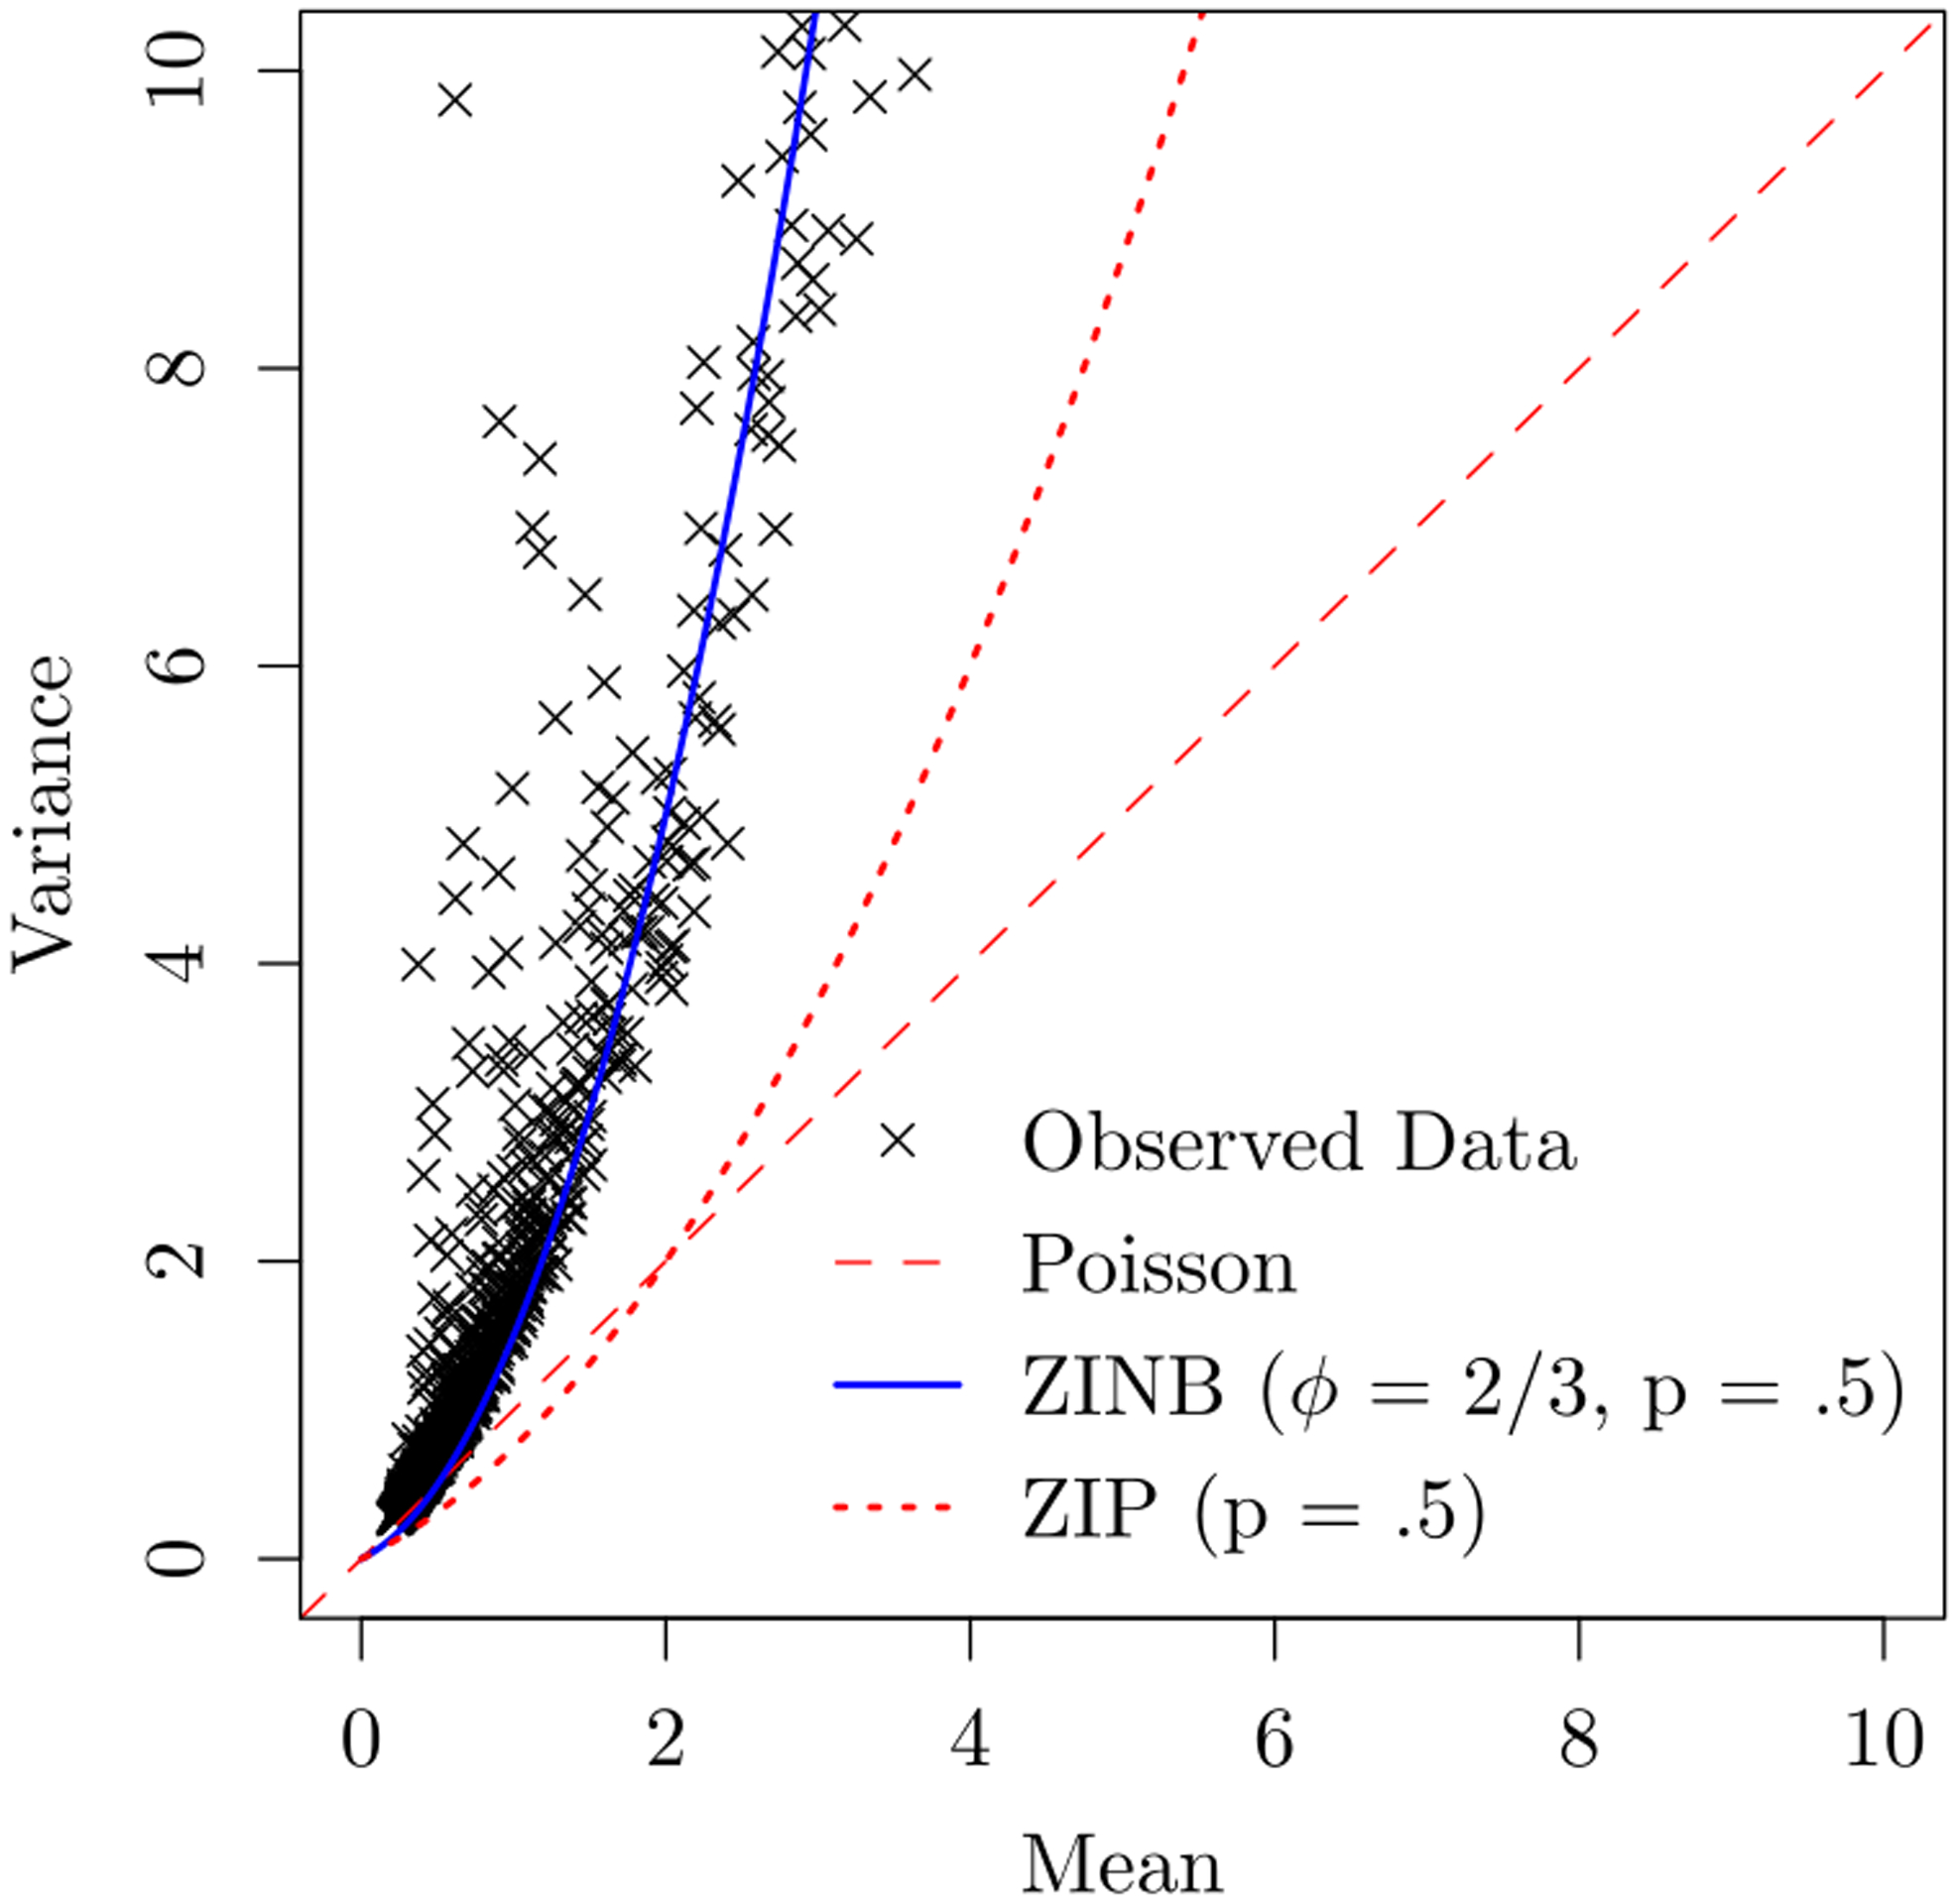
Figure 2:

Presence of overdispersion in real data: Shows the need of a non-linear mean-variance relationship in the pancreatic islet data. Each point represents the mean-variance relationship for one gene. In the legend ϕ represents the overdispersion parameter of the negative binomial distribution and p represents the drop-out probability.
