Fig. 9.

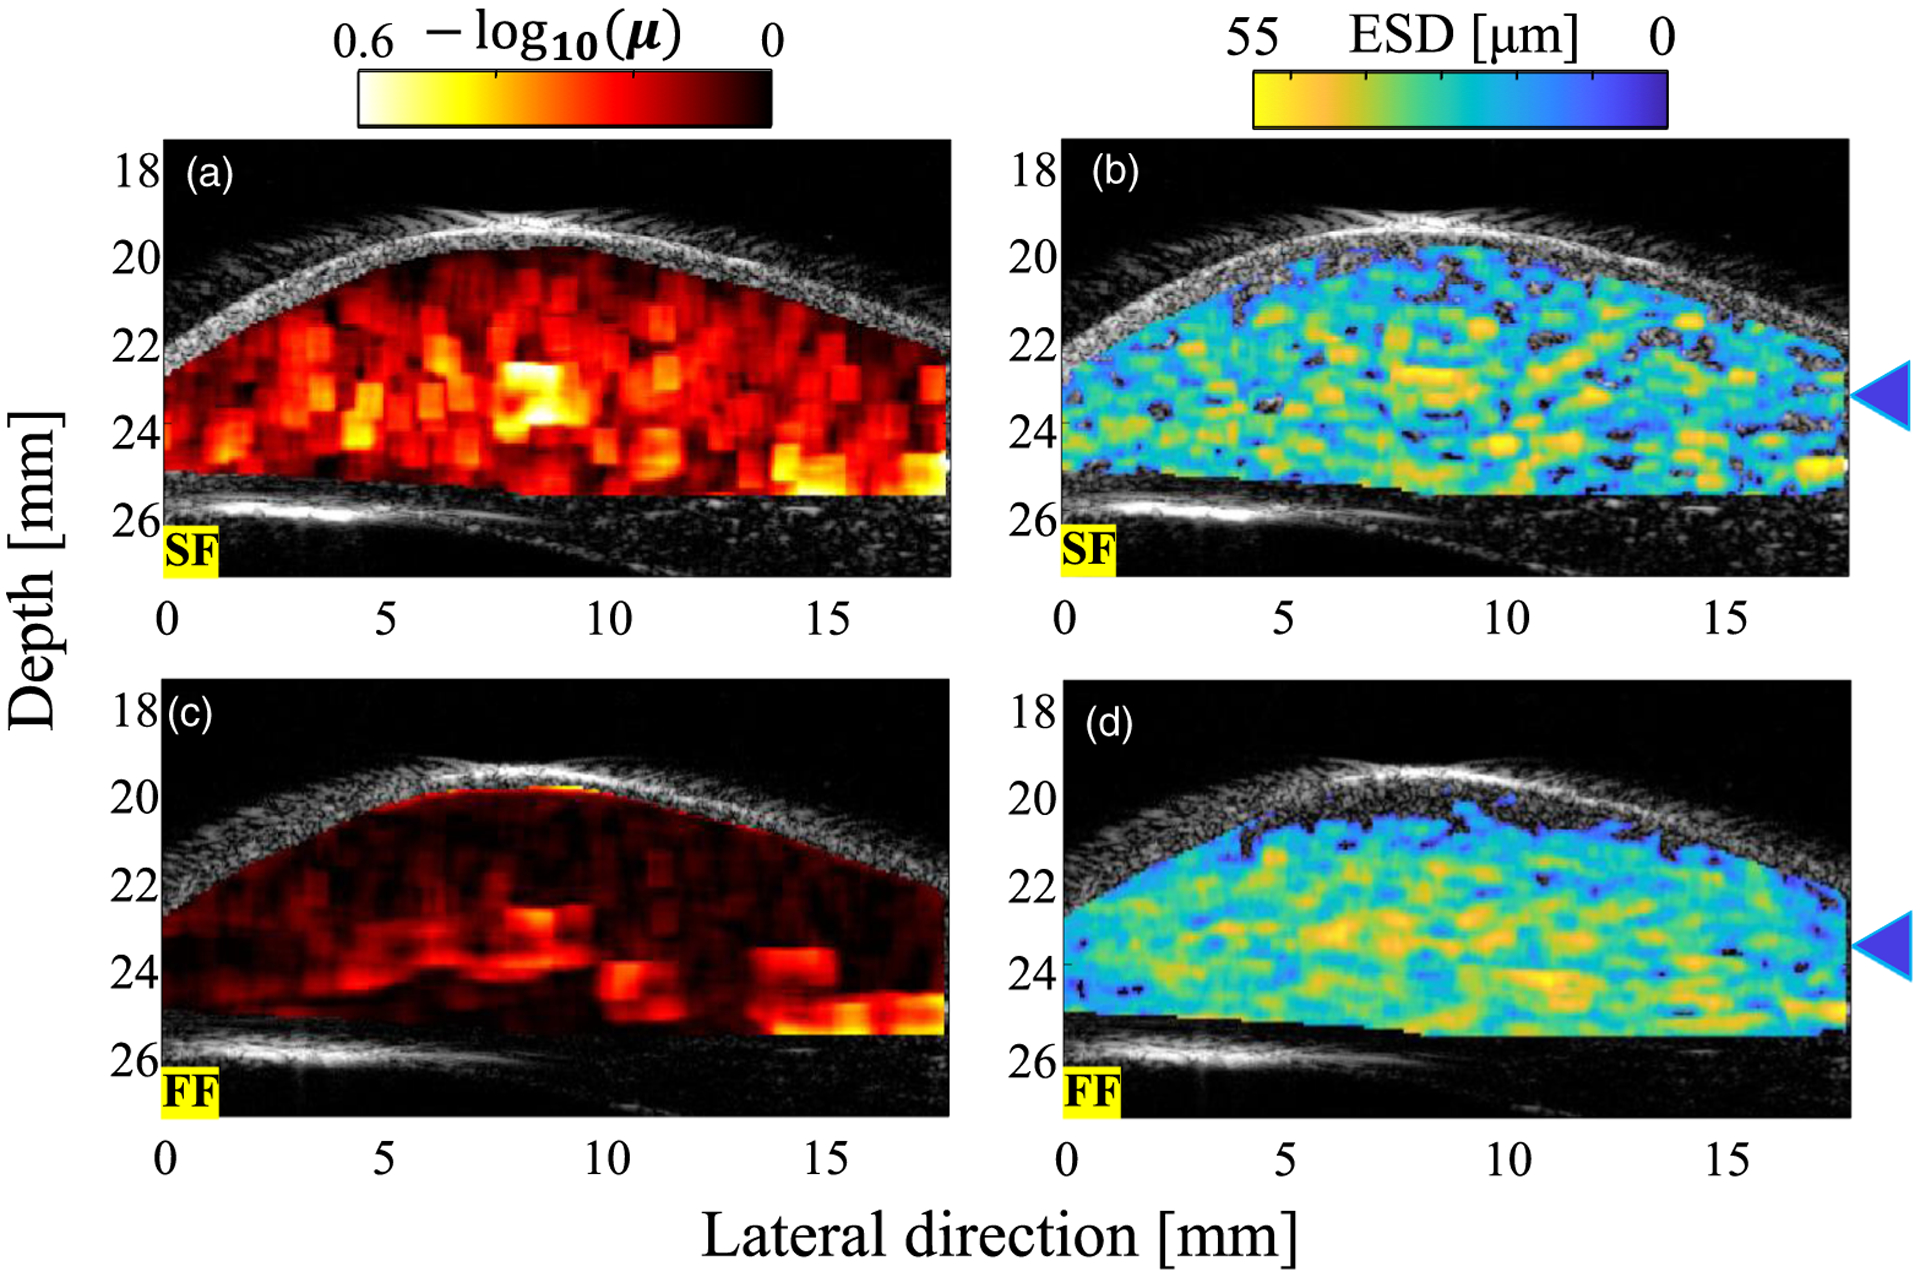
QUS parameters overlaid on the B-mode image of the rat liver for (a), (b) SF case and (c), (d) FF case. The blue triangles indicate the depth of the blood vessel.

QUS parameters overlaid on the B-mode image of the rat liver for (a), (b) SF case and (c), (d) FF case. The blue triangles indicate the depth of the blood vessel.