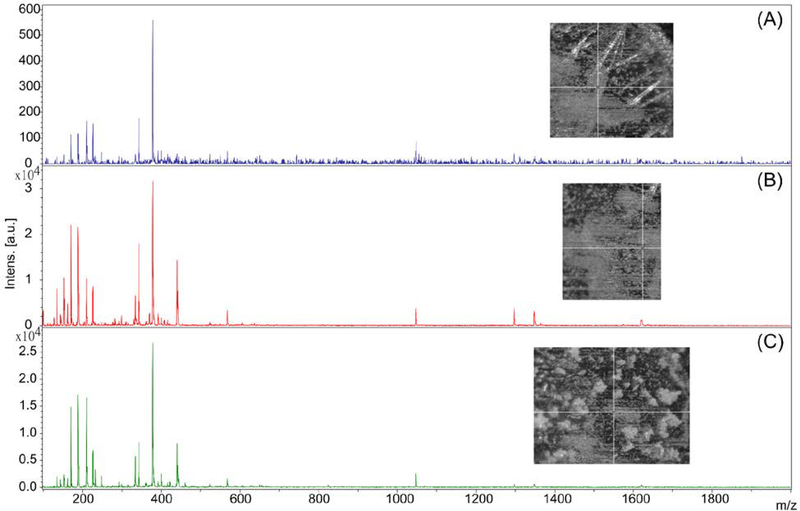
Figure 2:
Example of how differences in matrix application and crystallization can affect MALDI-TOF mass spectra. Three spots of Peptide Calibration Standard (Bruker) were co-crystallized with 50:50 alpha-cyano-4-hydroxy-cinnamic acid: 2,5-dihydroxybenzoic acid in 70:30 acetonitrile:MilliQ water w/ 0.1% trifluoroacetic acid. All spectra were acquired with the same calibrated method (Laser Power: 15%; Detector Gain: 6.2x; Shots: 200; Frequency: 60Hz; Mass Range: 100–2000 Da). (A) The first spot resulted in co-crystallization that produced large, slender crystals. These crystals resulted in weaker ionization producing low intensity spectra. (B) The second spot had much smoother co-crystallization. This resulted in higher intensity ionization across our entire mass range. (C) The third spot produced large, rounder crystals. Smaller mass peaks (< 300 Da) were able to ionize well, but larger mass peaks (> 1200 Da) were not able to ionize well.

