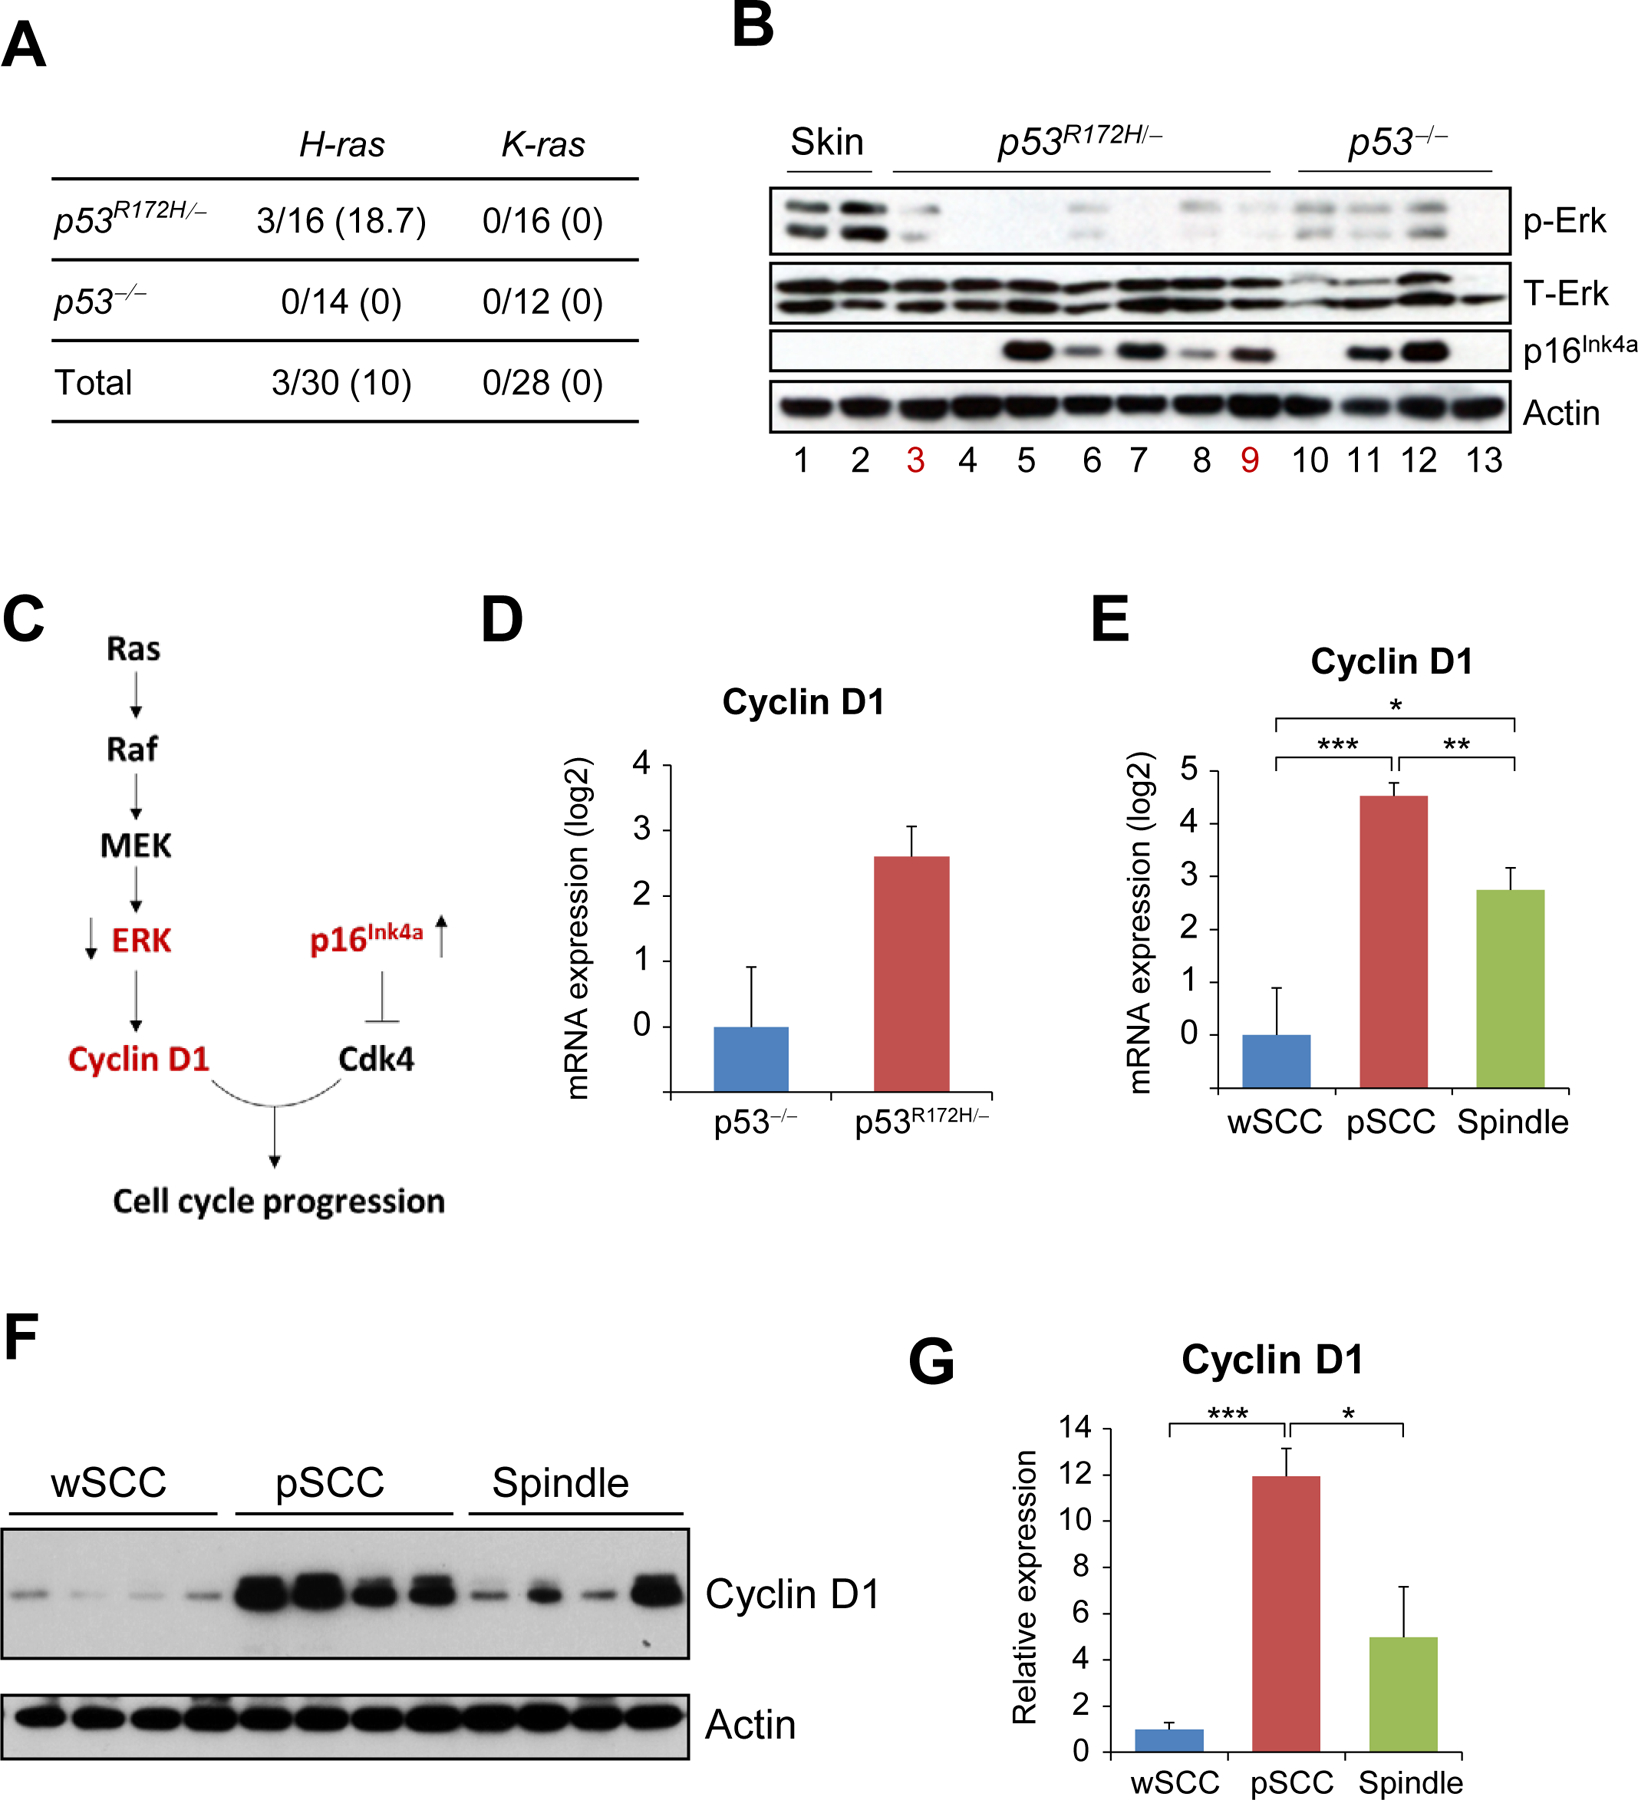
Figure 2.

Overexpression of Cyclin D1 in pSCCs induced by p53 mutations. (A) Mutation rates for H-ras and K-ras in p53R172H/- and p53−/− tumors. The data represents number of tumors with mutations in each gene, with percentages shown in parentheses. (B) Western blot analysis of the indicated proteins and tissue samples. Lane numbers in red indicate tumors with Ras mutation; all other samples had wt Ras. (C) Schematic representation of the interaction between ERK and p16Ink4a. The arrows next to ERK and p16Ink4a show the relative expression found in tumors induced by p53 mutations. (D) mRNA expression of Cyclin D1 in p53R172H/- tumors (n=13) and p53−/− tumors (n=11). Note that the difference is not significant. (E) Cyclin D1 mRNA expression was compared in tumors with the indicated tumor phenotypes: wSCC (n=8), pSCC (n=8), spindle (n=8). (F) Western blot analysis of Cyclin D1 in tumors with the indicated phenotypes. Actin was used as a loading control. (G) Quantification of the Cyclin D1 expression in the western blots shown on (F), normalized to actin. *P< 0.05, **p< 0.005, ***p< 0.0005.
