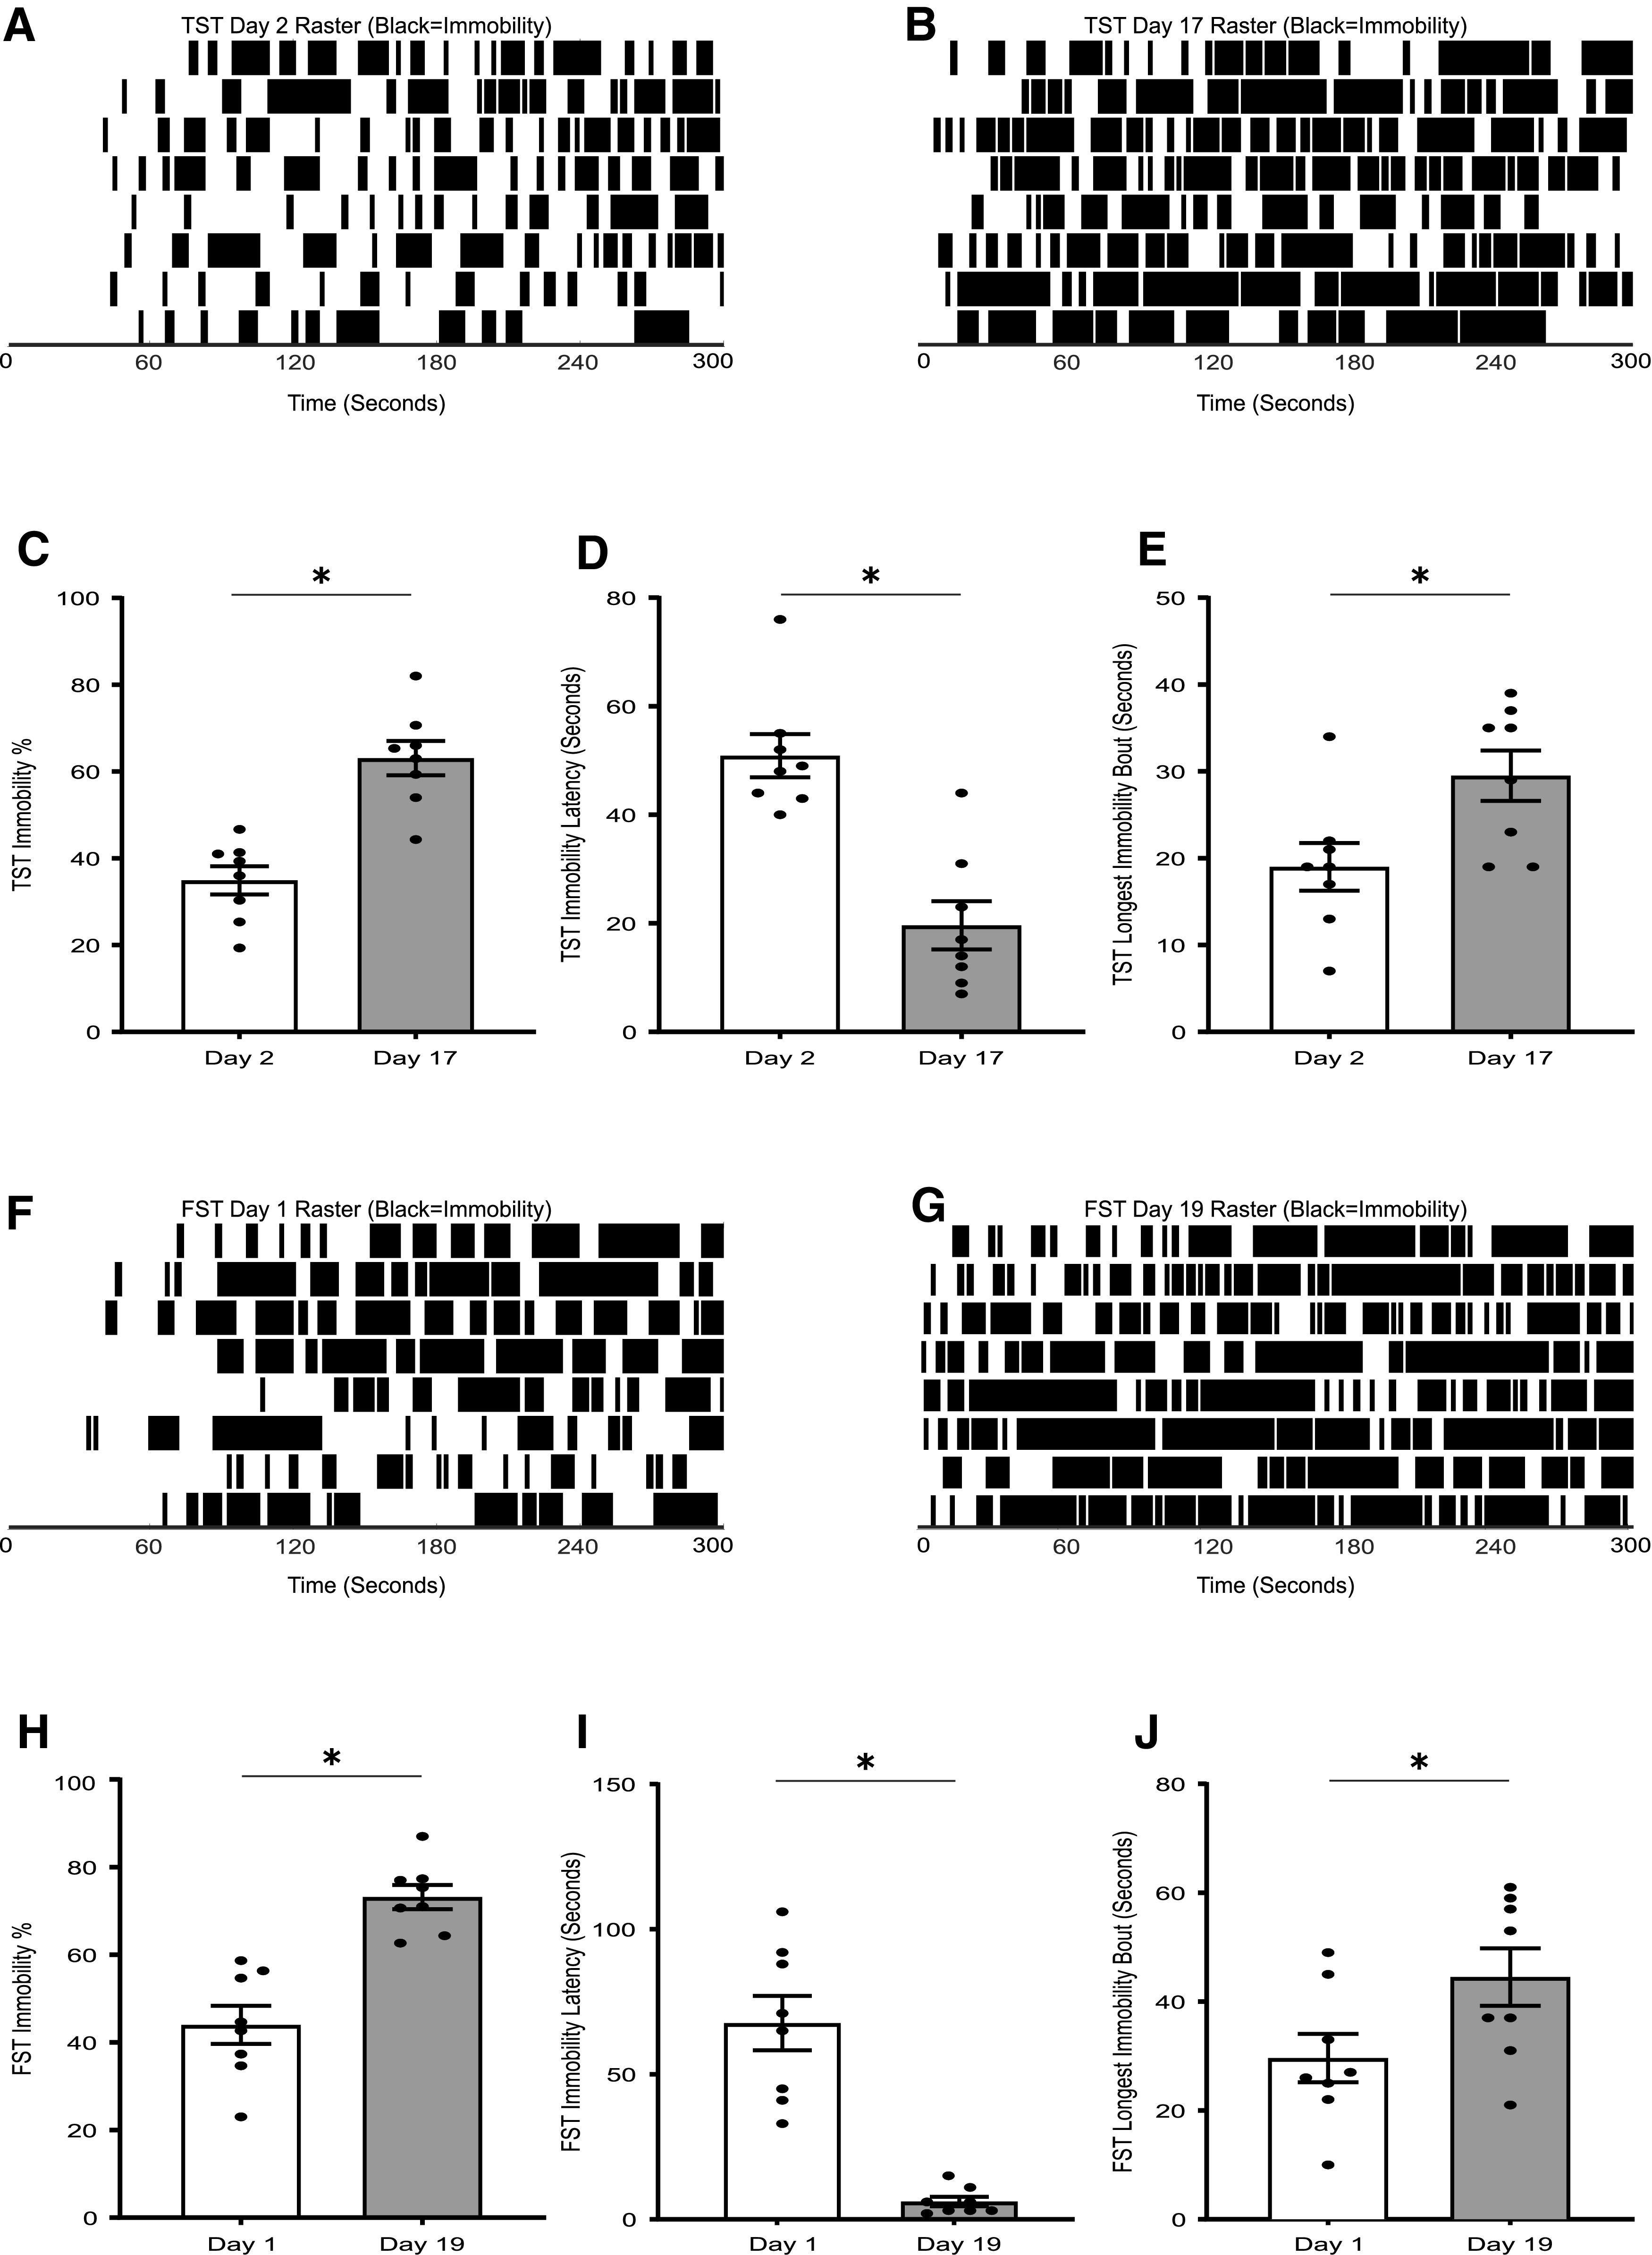
Figure 4.

Analysis of TST and FST behavior in the CMUS paradigm. Raster plots show the bouts of immobility (black) against time in the TST at (A) day 2 as compared with (B) day 17 of the 21-d-long CMUS paradigm. Bar graphs comparing the behavior in TST at day 2 and day 17 show (C) a significant increase in the % of time spent immobile, (D) a significant decrease in the latency to the first bout of immobility (seconds), and (F) a significant increase in the duration of the longest bout of immobility (seconds). Raster plots reveal the bouts of immobility (shown in black) as a function of time in the FST at (F) day 1 and (G) day 19 of the 21-d-long CMUS paradigm. Bar graphs show (H) a significant increase in the % of time spent immobile, (I) a significant decrease in the latency to the first bout of immobility (seconds), and (J) a significant increase in the duration of the longest bout of immobility (seconds) in the FST paradigm shows; *p < 0.05, two-tailed paired t test; n = 8 mice per group.
