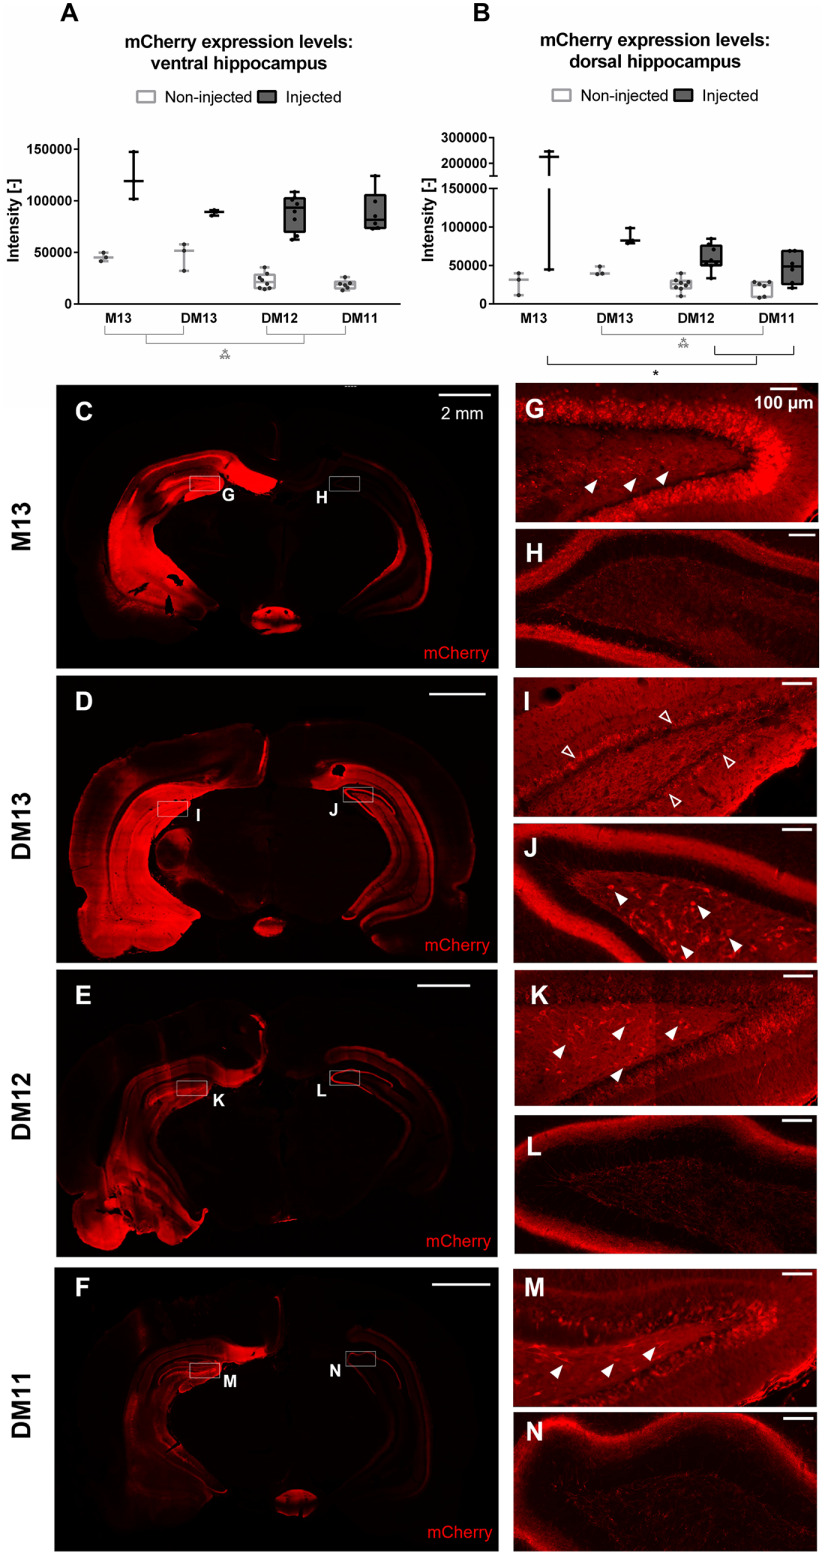
Figure 1.
DREADD-mCherry/mCherry expression at the level of injection sites. A, B, Intensity of mCherry staining at the injected and non-injected hippocampus at the level of the ventral (A) and dorsal (B) injection site for different viral vector titers. A higher titer is linked to higher mCherry levels in both the injected and non-injected hemisphere. Dots represent individual animals. C–N, Images at the level of the ventral injection site obtained from representative examples of the M13 (C), DM13 (D), DM12 (E), and DM11 (F) group, respectively, obtained five weeks after AAV injection. The injected hippocampus is situated on the left side. Boxes indicate zooms, corresponding with the hilus of the ipsilateral (G, I, K, M) and contralateral (H, J, L, N) DG. mCherry-positive hilar cells are indicated with filled arrowheads. On the DM13 image, the molecular layer of the DG is indicated with open arrowheads. On the injected side, both mCherry-positive cell bodies and fibers are present. On the non-injected side, mCherry expression is limited to fibers, except in the DM13 group, in which positive cell bodies are present too. Scale bars: 2 mm (C–F) and 100 μm (G–N). Exposure time: 20 ms for M13 and 25 ms for DM13, DM12, and DM11; *p < 0.05, ***p < 0.001. M = mCherry, DM = DREADD-mCherry. The high-resolution zooms were contrast-enhanced using the FIJI plugin “contrastenhancer” with 0.3% saturated pixels//normalize (unchecked)//equalize histogram (unchecked).

