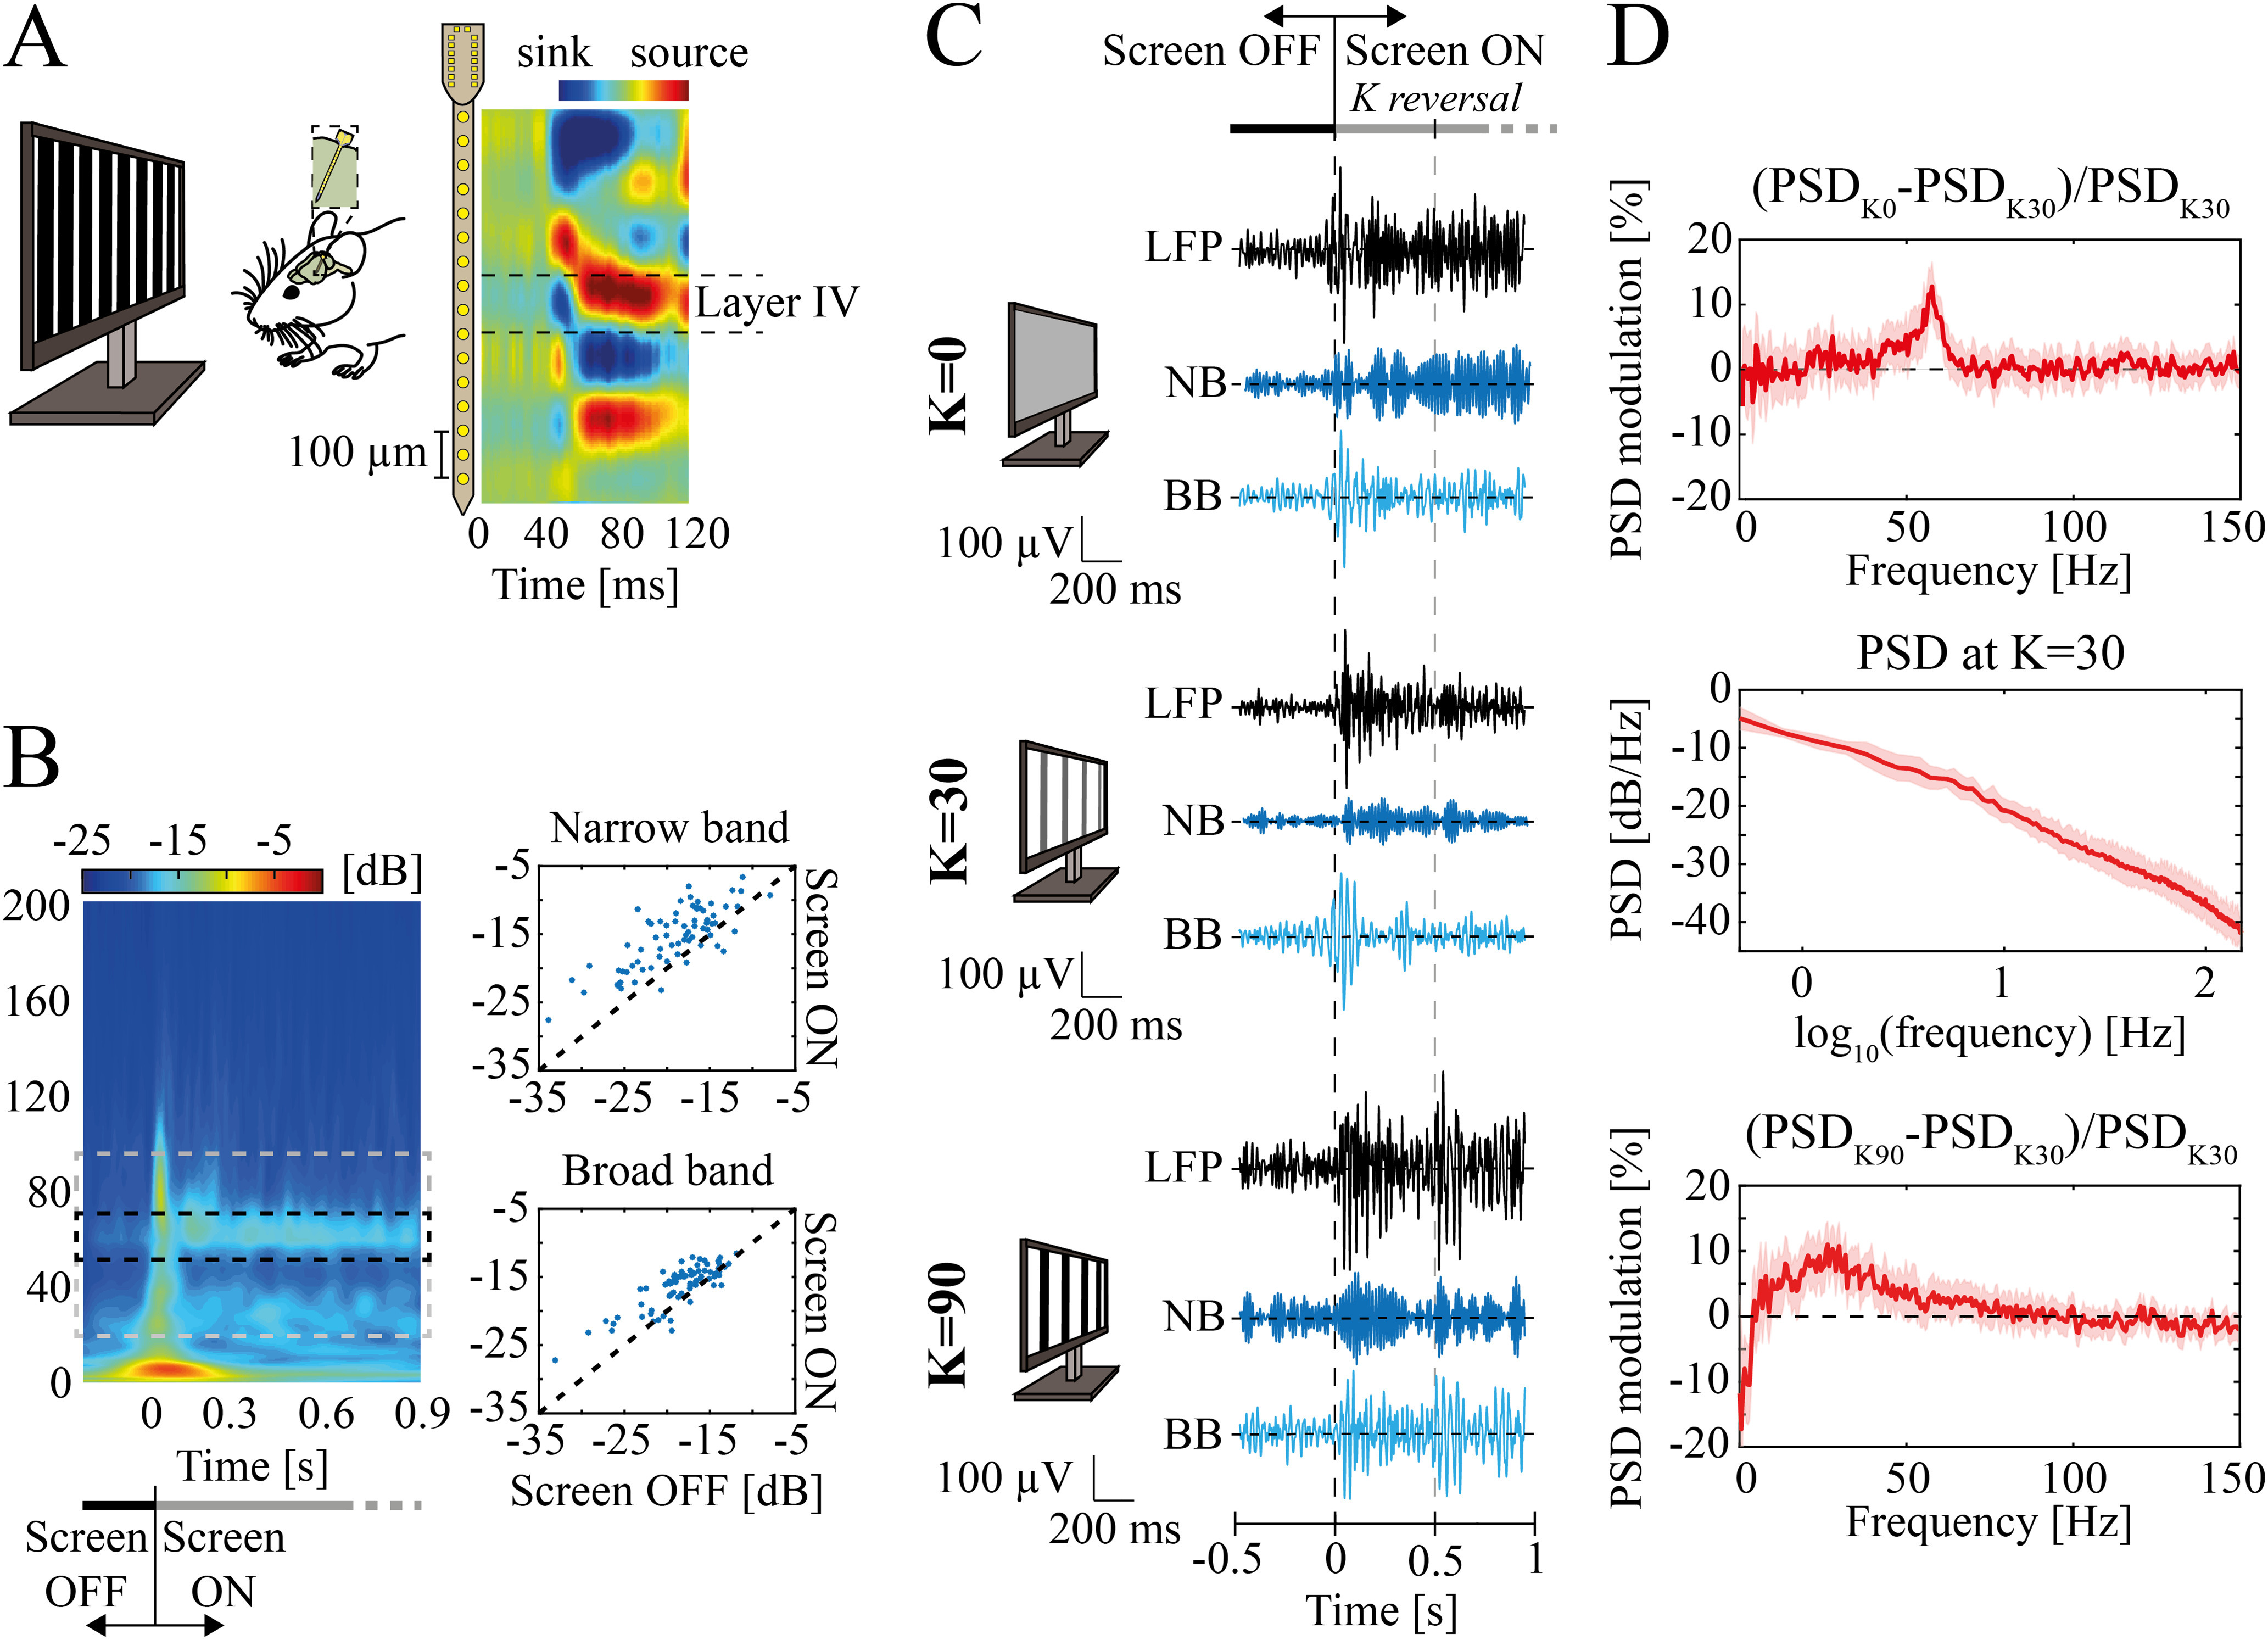
Figure 1.

Experimental setup and data. A, left, Representative scheme of the experimental design. Square-wave 1-Hz alternating gratings at different contrast levels were used for visual stimulation. A linear 16-channels probe (with 50-μm spacing between electrodes) was inserted into the mouse V1. Right, Mean across animals of current source densities (CSDs) aligned by the earliest current sink. B, left, Mean scalogram for contrast equal to 0 (K=0) within −200 to 900 ms around screen onset (for K = 0). The dashed rectangle depicts the frequency bands ranges: narrow band (NB, middle, black) and broad band (BB, gray). Right, Scalogram magnitude comparison between screen OFF (from −200 to 0 ms) and screen ON condition (from 0 to 900 ms) in high NB (top) and BB (bottom). Each dot represents one stimulus presentation for one mouse (n = 12 animals, 70 experimental points overall). Statistical differences were accounted for by the Wilcoxon’s matched pairs signed-rank test. For both γ bands, p values were far less than 0.001. C, Examples of filtered local field potential (LFP) recorded in mice V1 while viewing a uniform gray screen (top), or alternating gratings at contrast K = 30 (middle) and K = 90 (bottom). The examples are reported between [−0.5; 1] s around screen onset. Examples were filtered between (1) 10–100 Hz (black traces) just for representative purposes; (2) 45–65 Hz to display the NB; (3) from 20 to 45 Hz and from 65 to 90 Hz to display the BB range. Dashed lines indicate screen onset (black) and the first contrast reversal (gray). Monitors’ sketches schematically represent visual contrast. D, LFP modulation of minimal contrast (i.e., K = 0; top) and maximal contrast (i.e., K = 90; bottom) with respect to the power spectral density (PSD) at K = 30 (middle). Modulation is defined as the difference between the power of a frequency at a given contrast level (K = 0 or K = 90 in this case) with the power at reference contrast K = 30, normalized to the latter power. Shaded regions indicate standard error of the mean (SEM).
