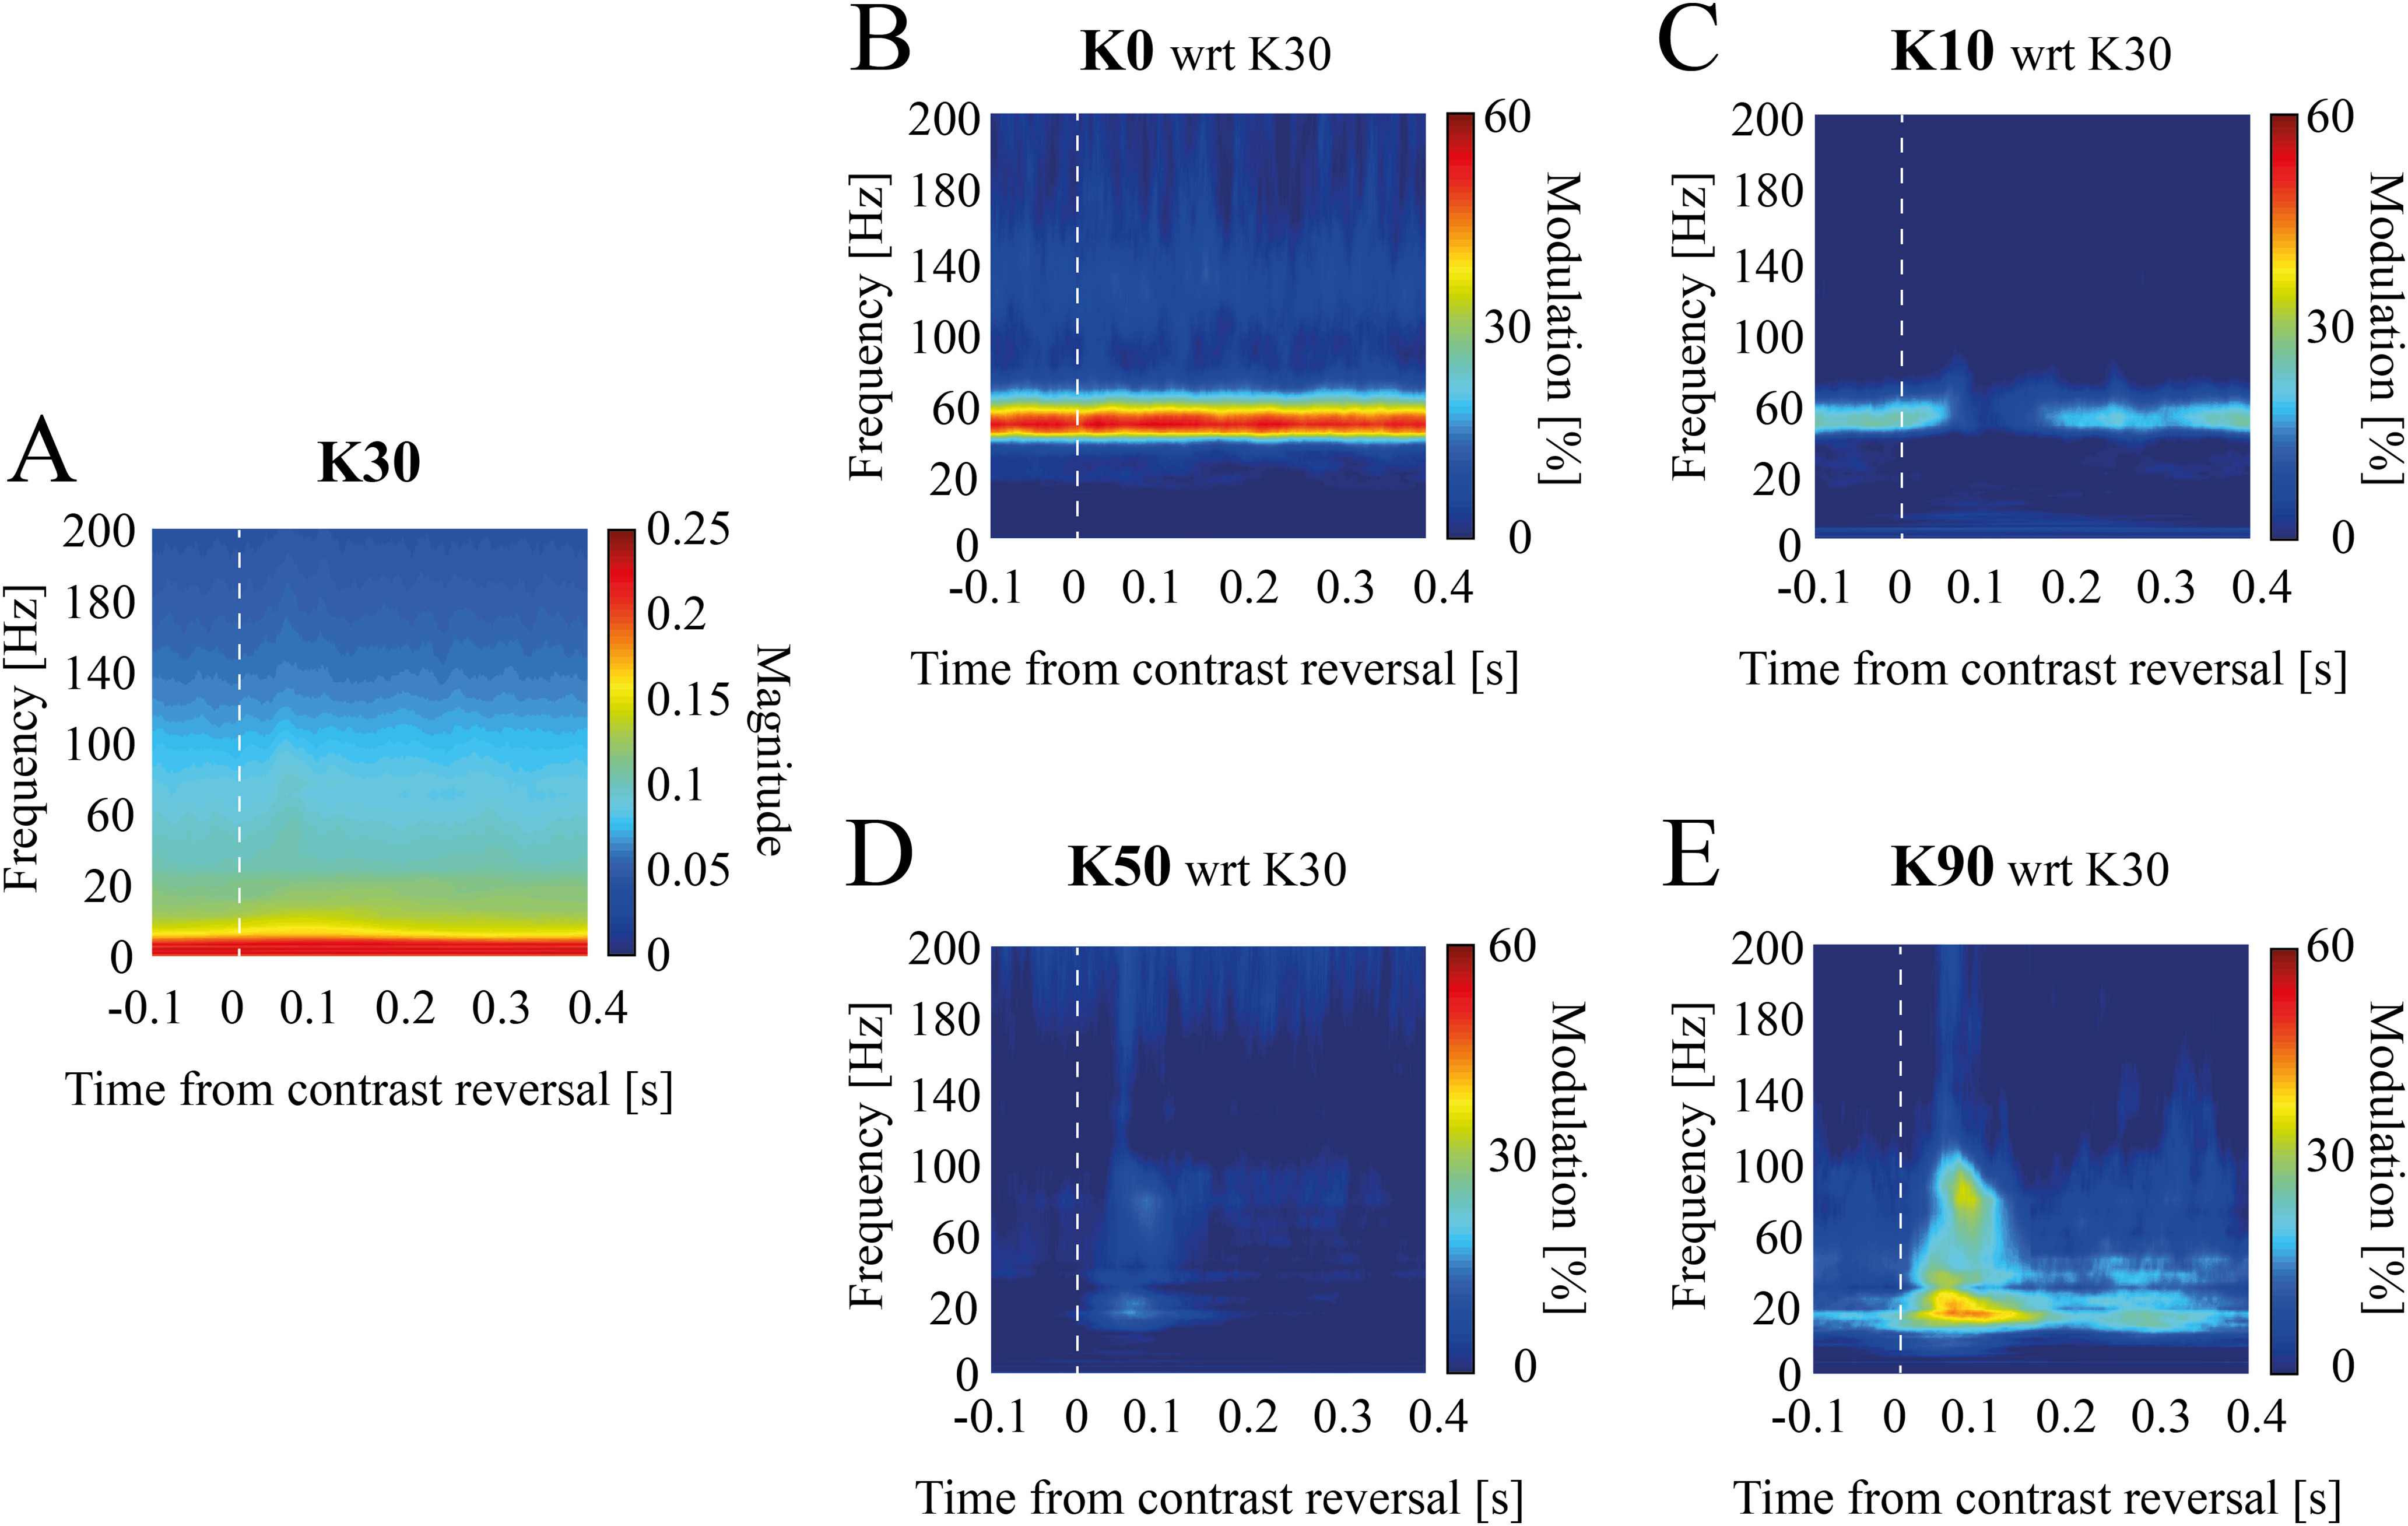
Figure 4.

Temporal evolution of contrast-dependent spectral modulation in experimental data. Mean scalogram modulation with respect to K = 30 (A) for experimental data at K = 0 (B), K = 10 (C), K = 50 (D), and K = 90 (E). Scalograms were averaged [−100–400] ms around contrast reversal instants (see Materials and Methods).
