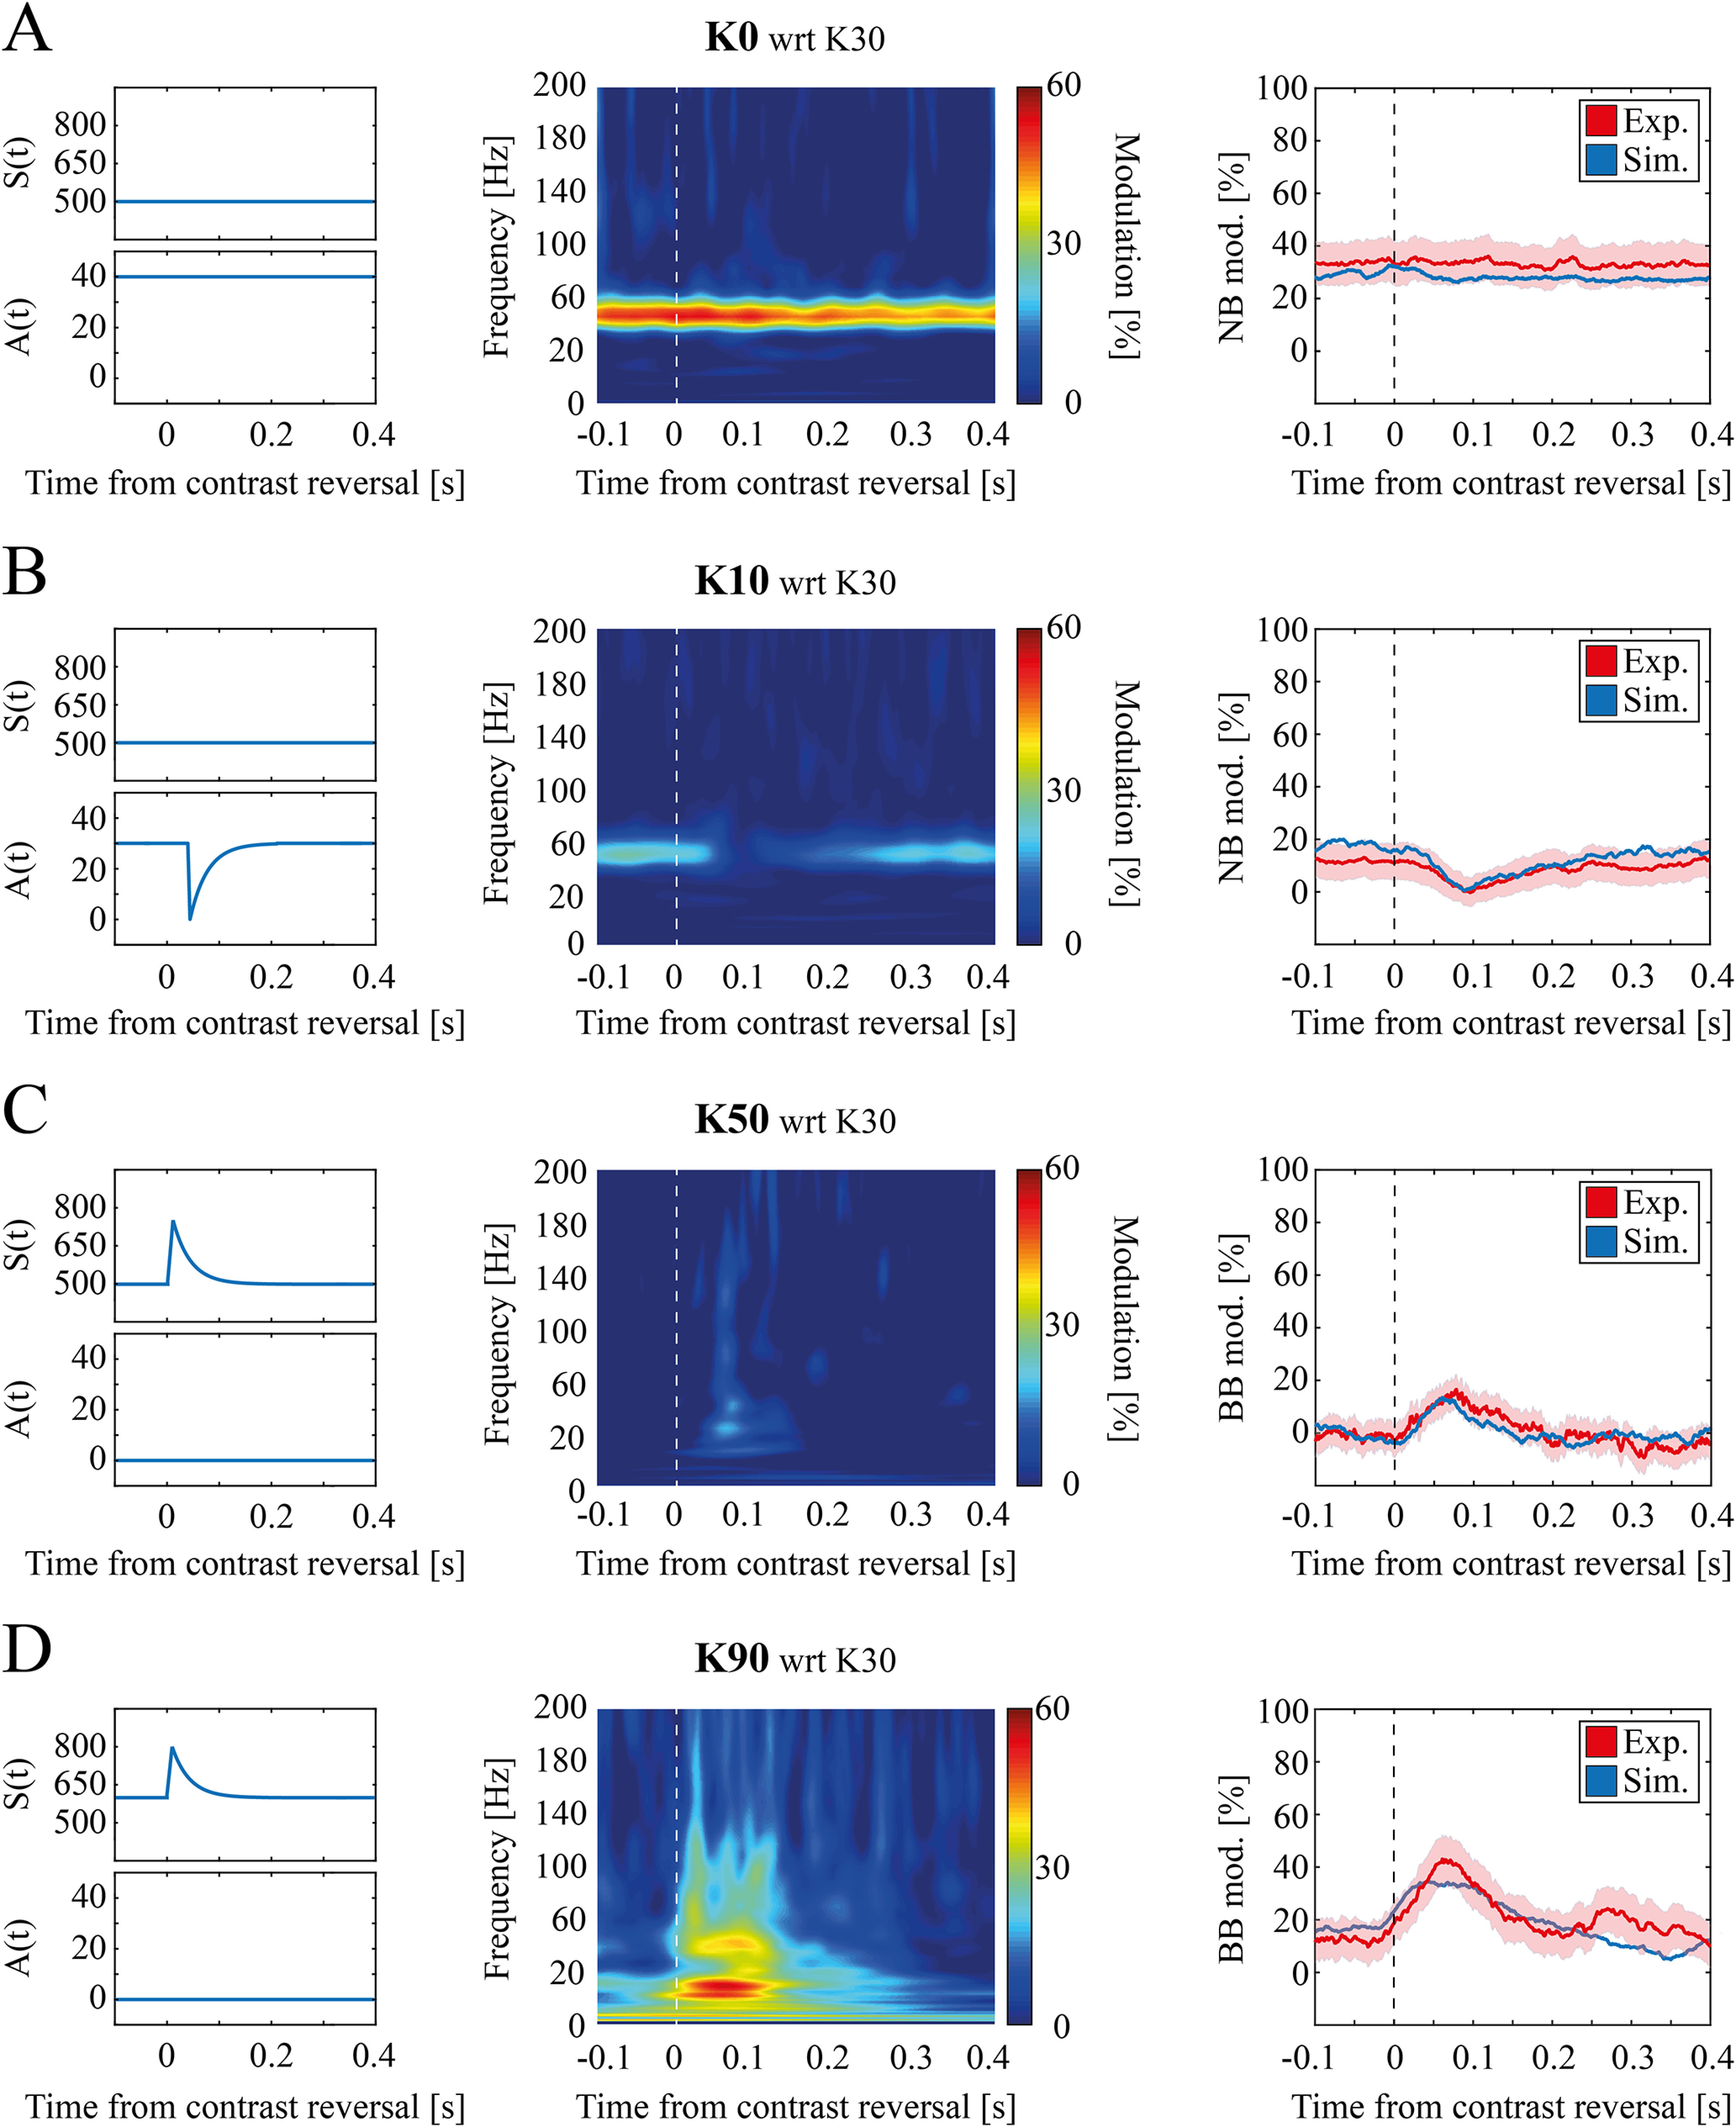
Figure 7.

Temporal evolution of contrast-dependent modulation in simulated data. A, left, Time course of thalamic input model parameters for K = 0. Middle, Scalogram mean modulation at K = 0 with respect to K = 30 for simulated data. Right, Time evolution of narrow band modulation for experimental (red) and simulated (blue) data (shading reflects SEM). B, Same as A for K = 10. C, left, Time course of thalamic input model parameters for K = 50. Middle, Scalogram mean modulation at K = 50 with respect to K = 30 for simulated data. Right, Time evolution of broad band modulation for experimental (red) and simulated (blue) data (shading reflects SEM). D, Same as C for K = 90.
