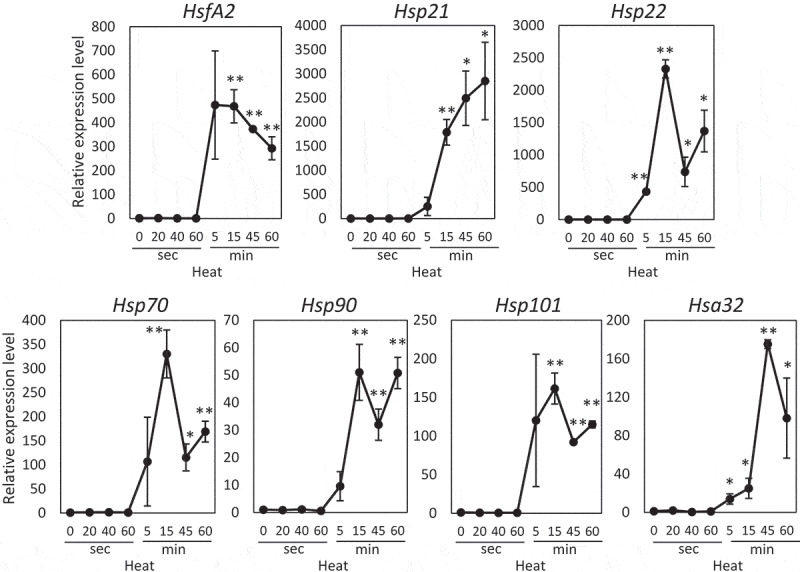
Figure 1.

Accumulation of transcripts encoding different acclimatory proteins during heat stress. Plants were sampled immediately after the exposure to 20–60 s or 5–60 min heat stress (40°C). Steady-state level of transcripts was then determined by quantitative real-time PCR (qPCR) analysis as described in the method part. Relative expression (Y-axis) was determined based on the threshold cycle values for target transcripts that were calculated with the CT of Ef1a as an internal control. * and **; Student’s t-test significant at p < .05 and p < .01, respectively, compared to control. Bars indicate standard error (n = 3).
