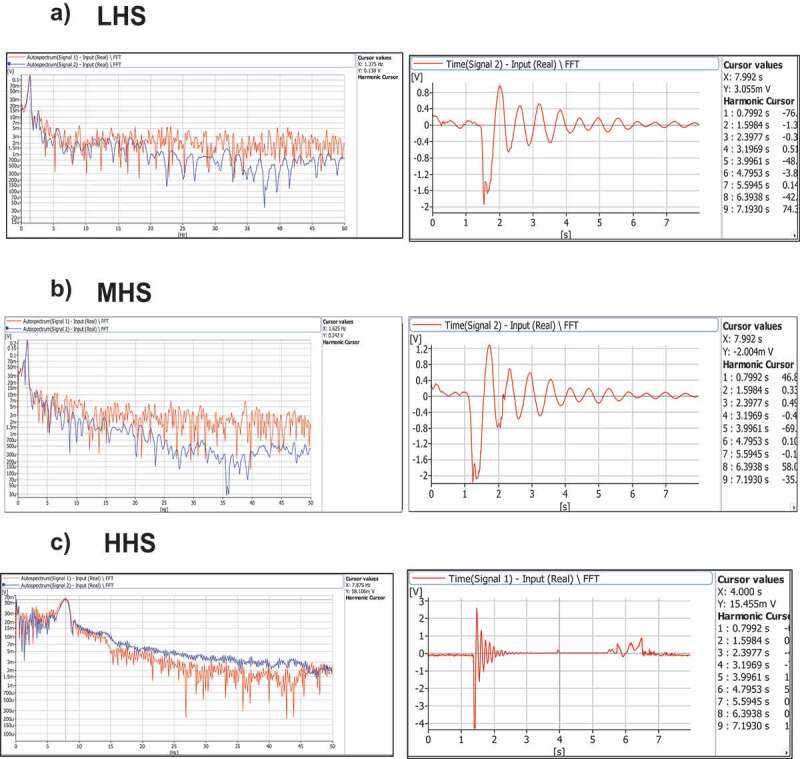
Figure 2.

Vibration frequency and time domain spectra from Capsicum annuum. from the experimental result of displacement velocity from the stem of C. annuum plants using a doppler laser displacement sensor (see Figure 2). The displacement velocity of LHS, MHS, and HHS waveforms corresponding to the frequency domain using Fast Fourier transforms (right graphs) and its respective time-domain obtained from plants (left graphs) (a, b, and c). The red signal is the one obtained from 3D multi-scan laser. The blue line corresponds to a second signal from the second vibrometer (one single point) that was used as a reference point to avoid the possible source of noise.
