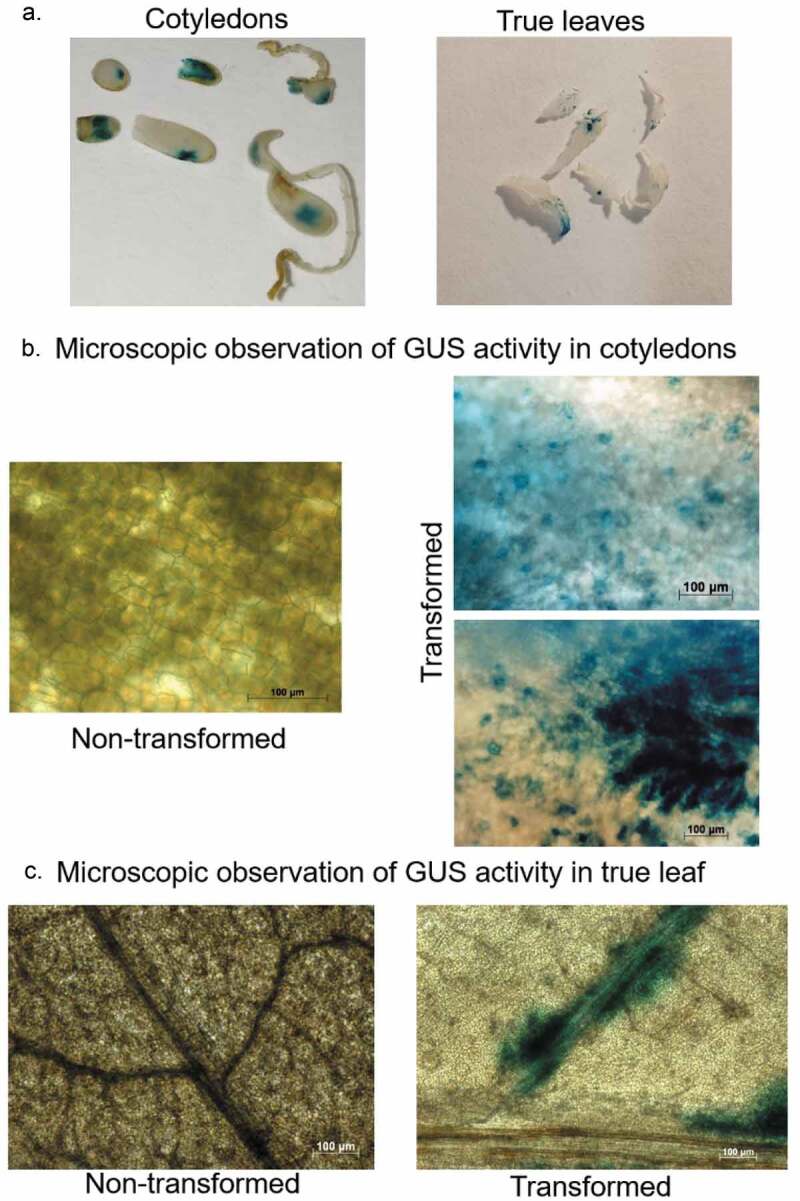
Figure 3.

Representative images of GUS activity analysis in cotyledons and leaves tissues of cannabis seedlings to confirm the transient transformation. (a) GUS activity analysis in cotyledons (left panel) and true leaves (right panel). (b) Microscopic observation of GUS activity in cotyledons, non-transformed tissue (left panel) and transformed tissue (right panel). Scale bar 100 µM. (c) Microscopic observation of GUS activity in true leaf, non-transformed tissue (left panel) and transformed tissue (right panel). Scale bar 100 µM.
