
Figure 5.
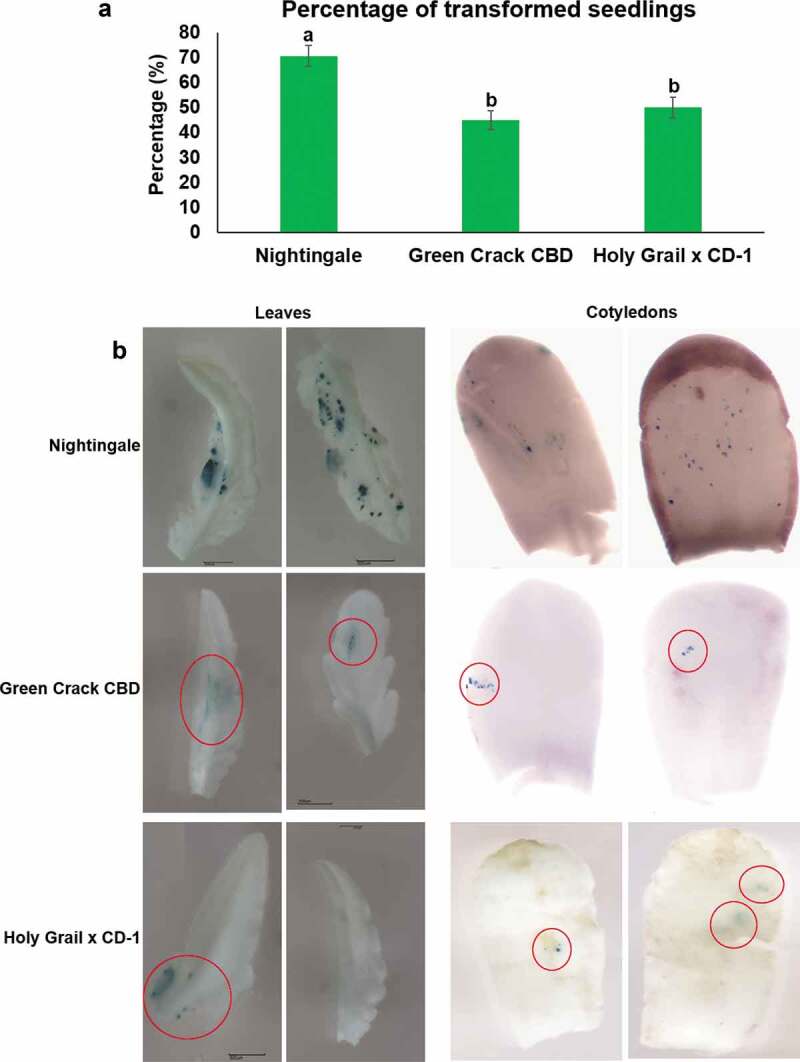
Comparative transient expression analysis among cannabis varieties Nightingale, Green Crack CBD and Holy Grail x CD-1. (a) Percentage of transformed seedlings which showed at least one visible GUS staining dots in leaves and/or cotyledons. Four independent transformation experiments were carried out and in one independent experiment 30 seedlings were used. The data were analyzed by one-way ANOVA with Tukey’s multiple comparisons test using GraphPad Prism version 8.4.2 for Windows. Data are shown as average mean ±SE (n = 4). A p-value less than 0.05 (p ≤ 0.05) were considered statistically significant. Mean values that were significantly different from each other are indicated by different letters. (b) Representative images of comparative GUS staining. The Nightingale exhibited the GUS staining dots throughout the leaves and cotyledons. However Green Crack CBD and Holy Grail x CD-1 varieties showed only fewer GUS staining dots which are red circled.