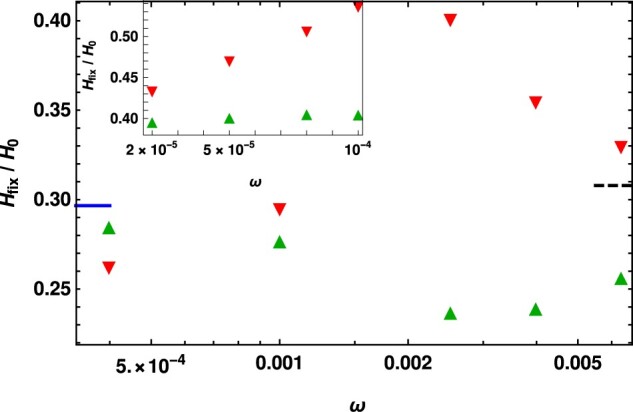
Figure 5.

Reduction in the mean heterozygosity at the linked neutral locus due to the fixation of dominant and recessive mutant () with selection coefficient and , respectively, to show that the heterozygosity following the fixation of deleterious and beneficial mutant is significantly different in the changing environment, unlike in the static environment where they are identical. The reduction in the mean heterozygosity in the static environment with selection (solid line) and in the neutral environment (dashed line) are also shown for comparison. All the data are obtained by numerical simulations. The inset shows the heterozygosity reduction due to the fixation of dominant mutant and recessive mutant () in the slowly changing environment with selection coefficient and -s(t), respectively. The other parameters for both figures are and , where c is the recombination probability, Q0 and R0 are, respectively, initial relative frequencies of a neutral allele in a chromosome with a and A allele on the first locus, and the population size N = 500 (main) and 1000 (inset).
