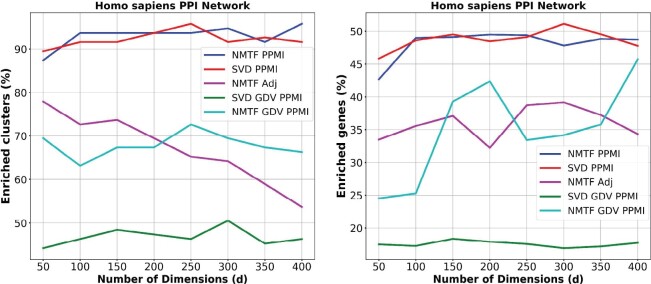
Fig. 1.
Functional coherence of the embedding spaces. For each dimension (x axis), the percentage of clusters (y axis, panel A) with at least one GO BP function enriched and the percentage of enriched genes (y axis, panel B) in the clusters that are obtained in the embedding space generated by each of the NMTF PPMI decomposition (blue), SVD PPMI decomposition (red), NMTF Adj decomposition (purple), SVD GDV PPMI decomposition (green) and NMTF GDV PPMI decomposition (cyan)

