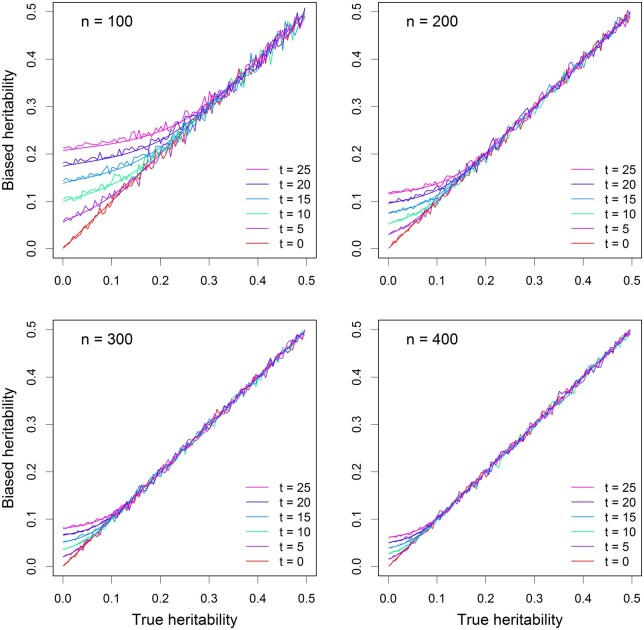
Figure 1.
Comparison of estimated QTL heritability with true QTL heritability from replicated simulation experiments. There are four different sample sizes (n) and six different thresholds of test statistics (t). The simple linear model (without polygenic background control) was used in the simulation experiments. The smooth curves represent the theoretically calculated QTL heritability and the noisy curves are the average QTL heritability estimated from 40 replicated simulation experiments.

