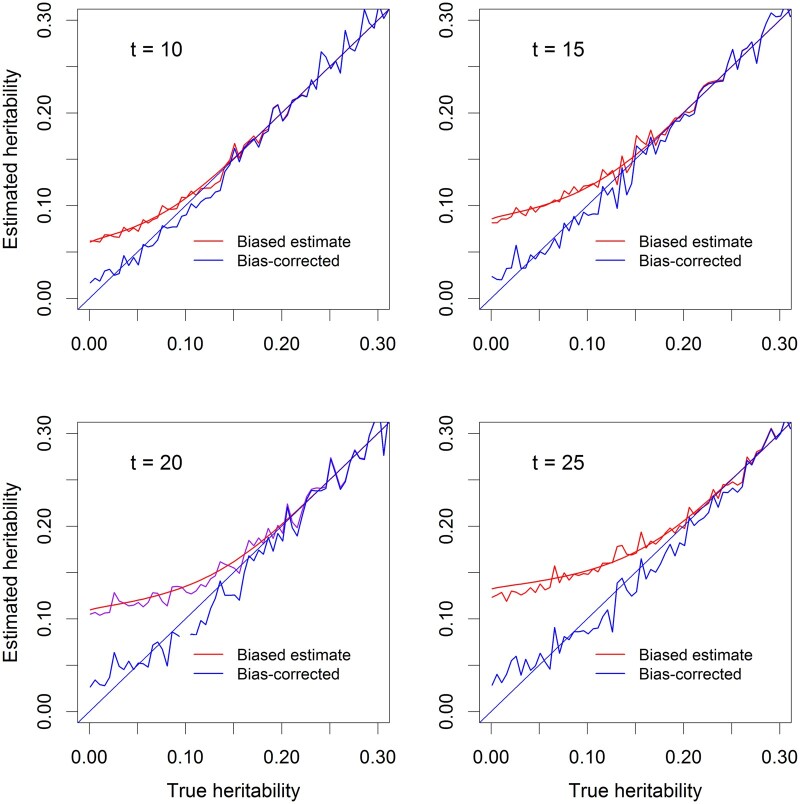
Figure 4.
Correction for the bias of estimated QTL heritability. The linear mixed model was used (with polygenic background control). There are four levels of the test threshold (t = 10, 15, 20, 25) and the sample size is n = 100. The noisy curves are the average estimated QTL heritability from 40 replicated simulation experiments. The smooth curves are the predicted QTL heritability. The red curves are the QTL heritability prior to the bias correction (deviated from the diagonal). The blue curves are the QTL heritability after the bias correction (closer to the diagonal).

