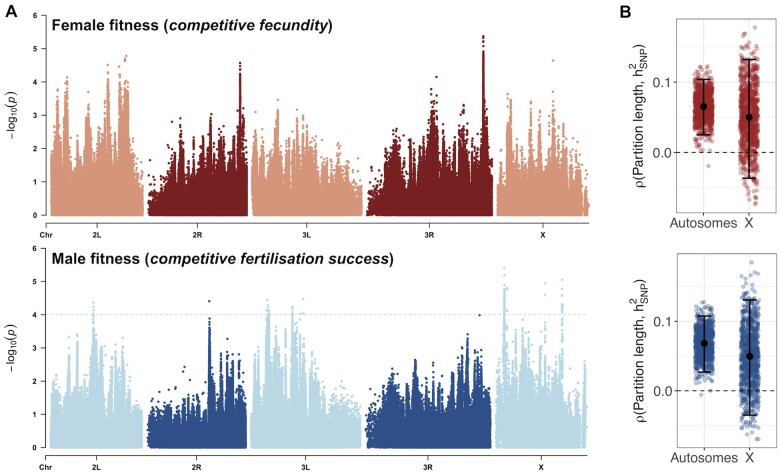
Figure 2.
A polygenic basis of sex-specific fitness. (A) –log10(p) values from a Wald association test of each SNP variant against female fitness (top) and male fitness (bottom), presented as Manhattan plots along the five major chromosome arms of the D. melanogaster genome. Grey dashed line denotes a 30% FDR threshold (q-values = 0.3) in males (no SNP reached the 30% FDR threshold in females, hence the absence of an equivalent line in females). (B) Spearman’s rank correlation coefficients between the length of a random chromosome partition and its SNP heritability, for females (red) and males (blue), on autosomes and X. Bars represent means and 95 confidence intervals across 1,000 partition sets.

