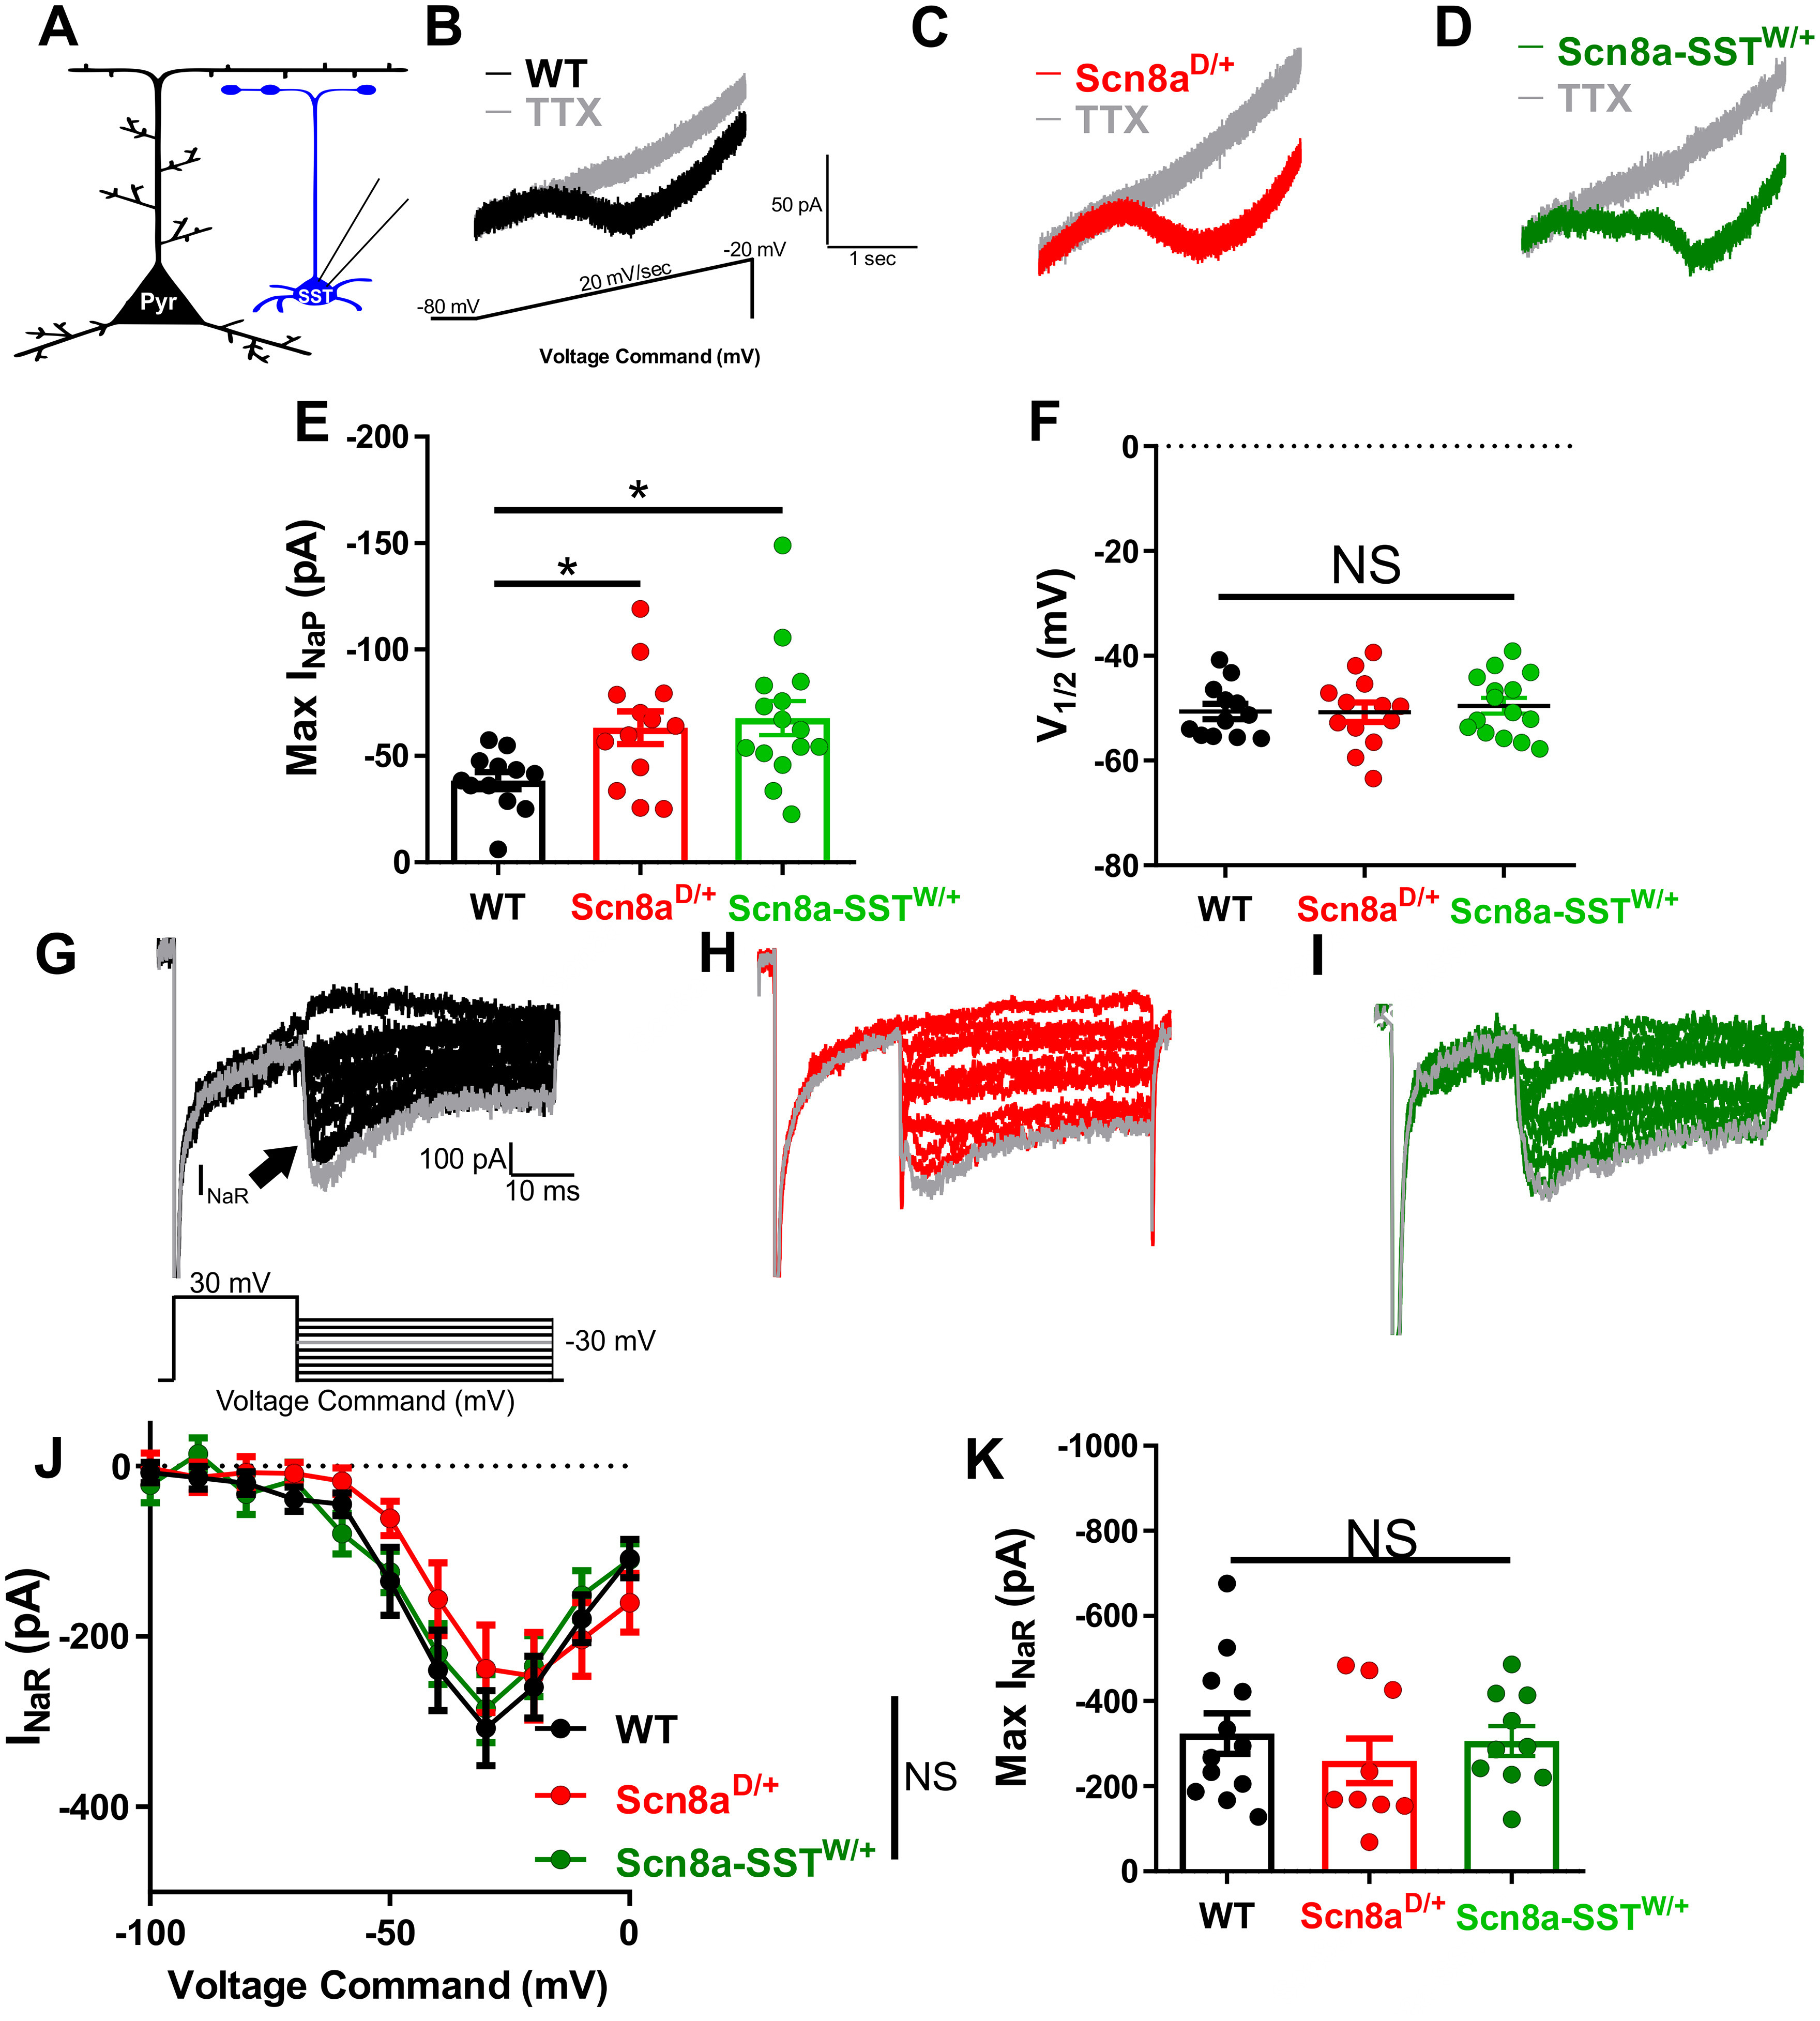
Figure 5.

Elevated persistent sodium currents in Scn8aD/+ and Scn8a-SSTW/+ SST interneurons. A, Whole-cell recordings were collected from SST interneurons (blue) to measure whole-cell persistent sodium currents. B-D, Example traces of steady-state INaP evoked by slow voltage ramps (−80 mV to −20 mV at 20 mV/s) before (black, red, or green) and after addition of TTX (500 nm; gray) for WT (B; black), Scn8aD/+ (C; red), and Scn8a-SSTW/+ (D; green) SST interneurons. E, Elevated maximum INaP in Scn8aD/+ SST interneurons (red; n = 13, 4 mice; *p < 0.05) and Scn8a-SSTW/+ (green; n = 14, 3 mice; *p < 0.05) compared with WT SST interneurons (black; n = 12, 4 mice; one-way ANOVA followed by Dunnett's multiple comparisons test). F, Half-maximal voltage of activation between WT, Scn8aD/+, and Scn8a-SSTW/+ SST interneurons was not significantly different between groups (NS; p > 0.05; one-way ANOVA followed by Dunnett's multiple comparisons test). G-I, Example traces of TTX-subtracted INaR for WT (G, black), Scn8aD/+ (H, red), and Scn8a-SSTW/+ (I, green), evoked by voltage commands in which the cell was stepped to membrane potentials of −100 to 0 mV, increments of 10 mV for 40 ms after first being stepped to 30 mV for 20 ms. The INaR (arrow) is observed for steps to −50 mV through 0 mV. J, No differences were observed in the INaR current–voltage relationship between WT (black; n = 12, 4 mice), Scn8aD/+ (red; n = 9, 3 mice), and Scn8a-SSTW/+ (green; n = 10, 3 mice). K, Maximum INaR magnitudes were not different between groups.
