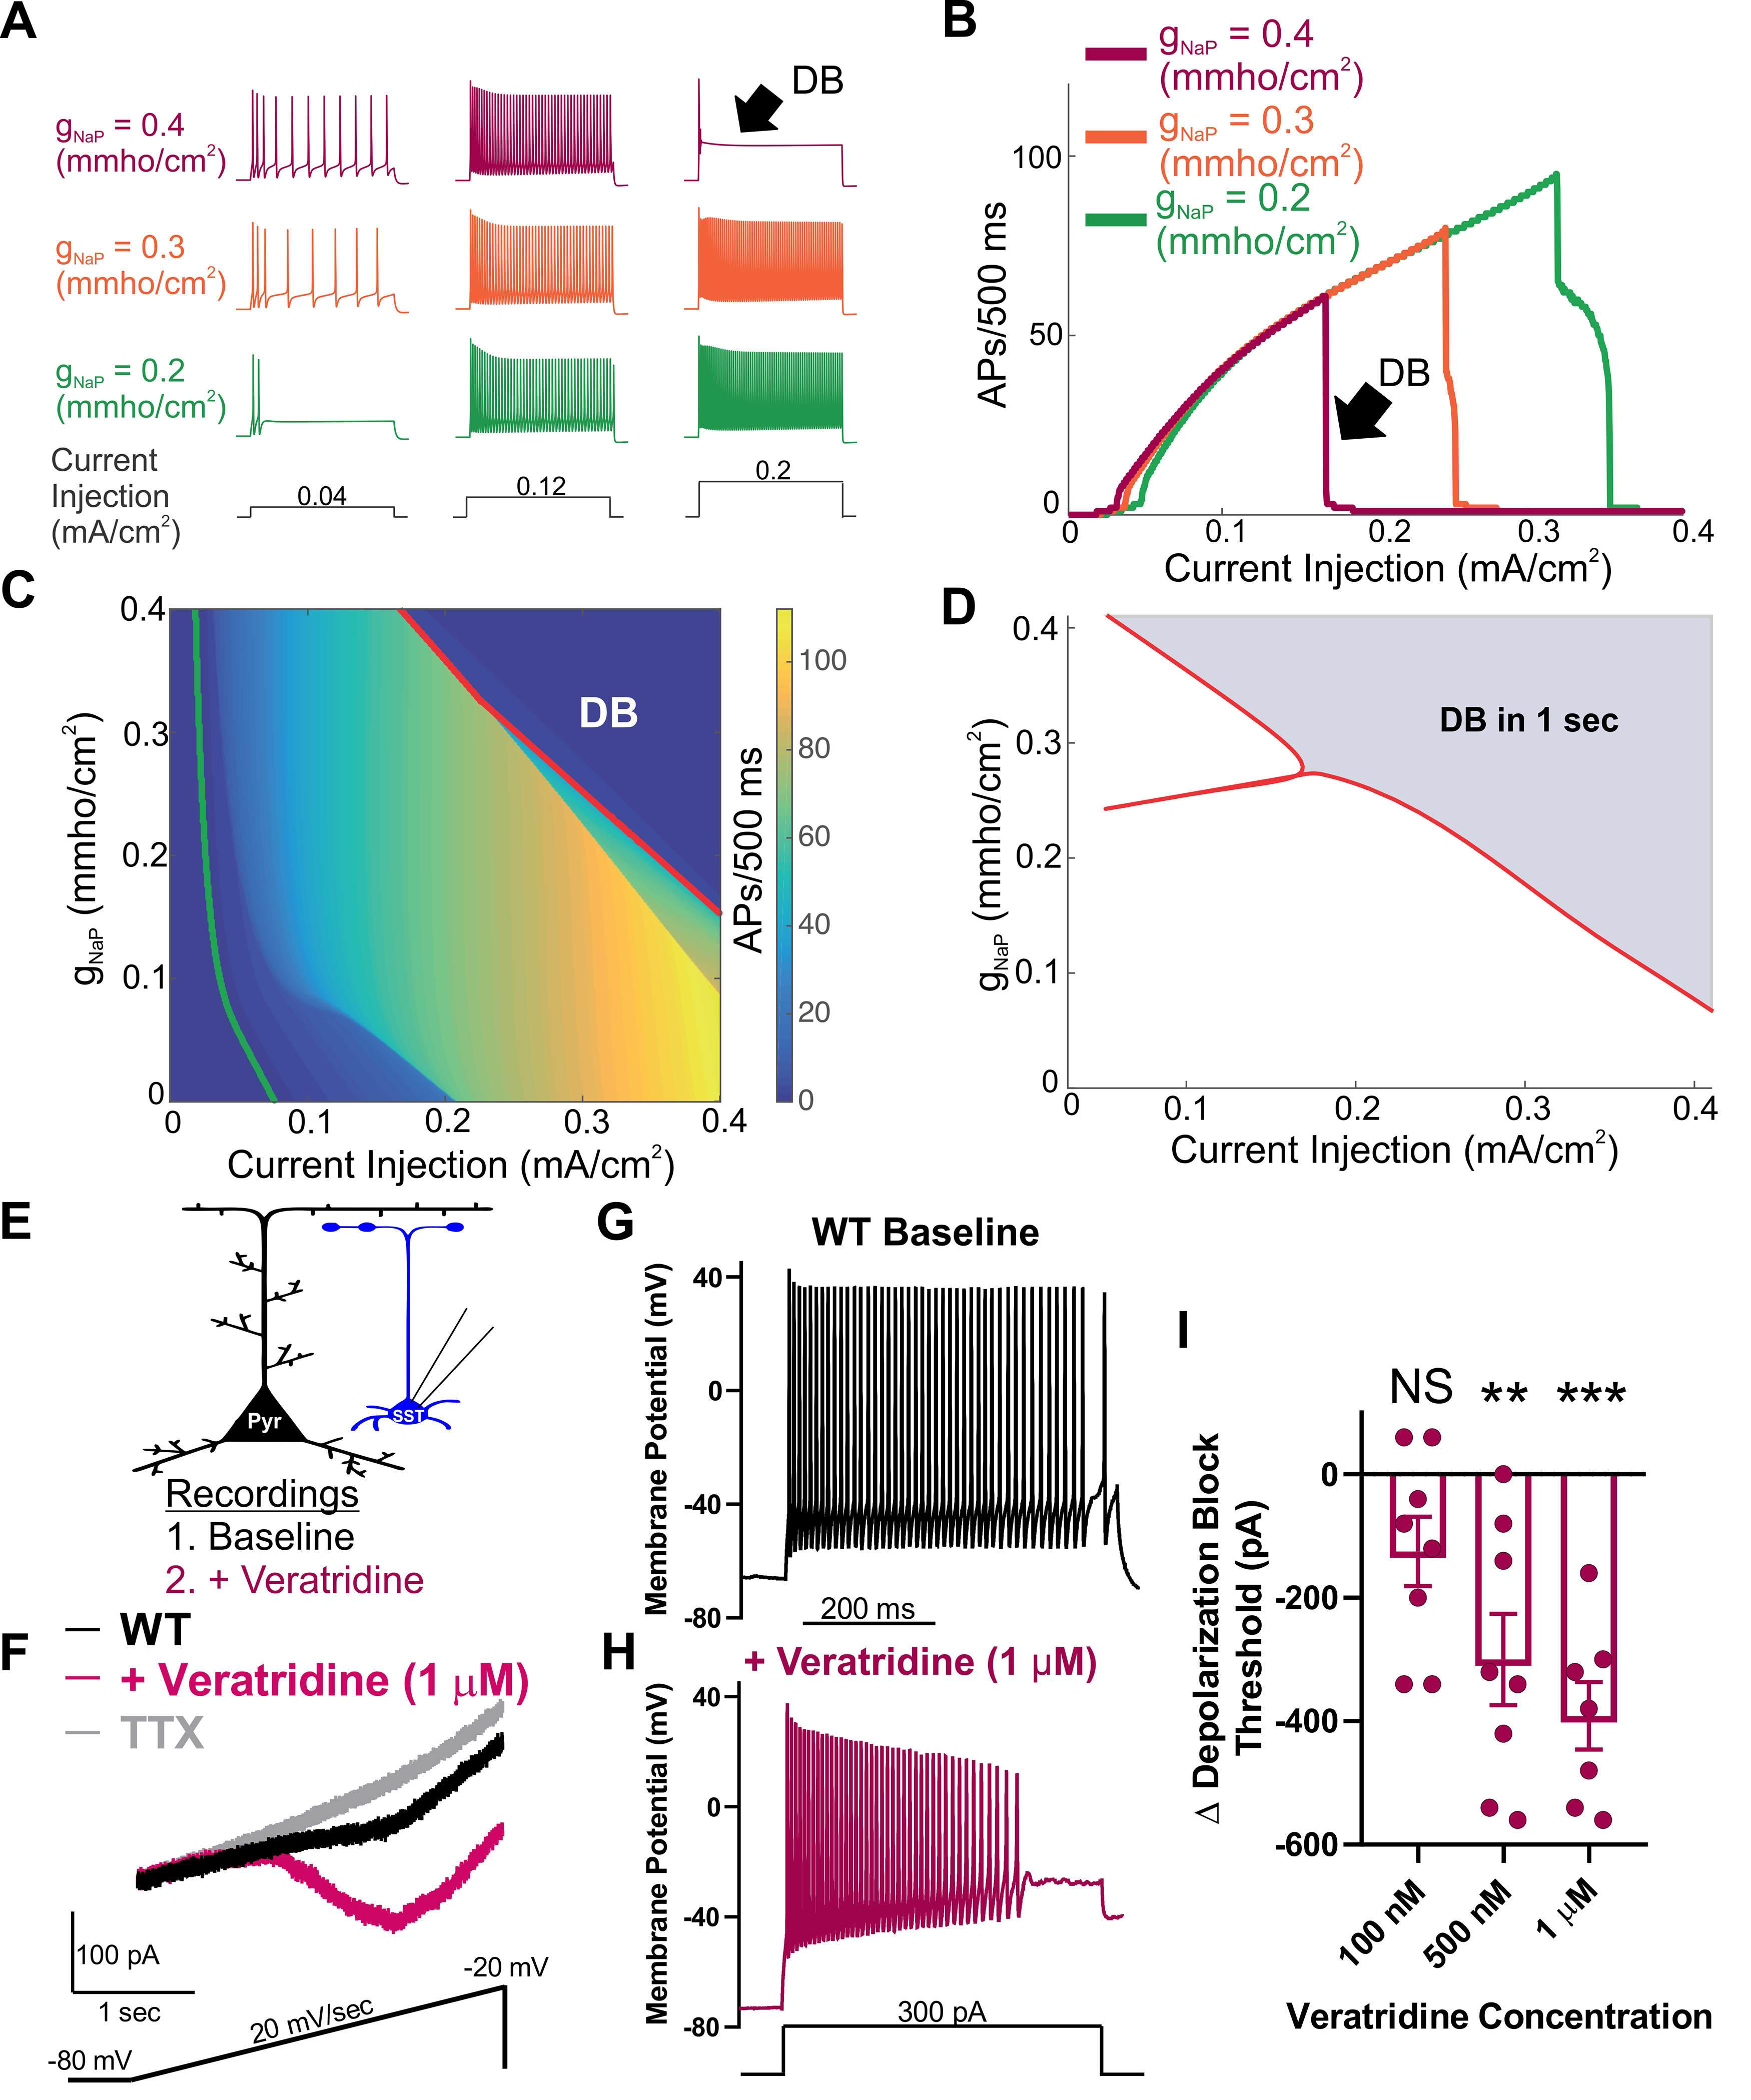
Figure 7.

Augmentation of the persistent sodium current induces depolarization block. A, Example traces of APs elicited in response to 500 ms current injections in an in silico neuronal model. The maximal persistent sodium conductance was varied from gNaP = 0.2 mmho/cm2 (green), through gNaP = 0.3 mmho/cm2 (orange) to gNaP = 0.4 mmho/cm2 (magenta), while the magnitude of the current injection was increased from 0.04 mA/cm2 (left), through 0.12 mA/cm2 (middle) to 0.2 mA/cm2 (right). Increasing gNaP increased the number of APs observed over the stimulation period at low current magnitudes, and led to failure of AP initiation at higher current injection magnitudes (black arrow, DB). B, Number of APs observed over the 500 ms stimulus relative to the current magnitude. As gNaP increases, the current magnitude required to induce depolarization block (black arrow, DB) decreases. C, Heat map showing the number of APs as both gNaP and the current injection magnitude are varied. Also shown is the rheobase current required to induce at least one AP (green line) and the curve at which the neuron ceases to generate repetitive APs as it enters depolarization block (red line, DB). D, Two parameter bifurcation showing the location of dynamic transitions leading to depolarization block as the gNaP and the current magnitude are varied. Red line indicates the shaded region of parameter space in which depolarization block occurs (over a 1s current pulse) from the unshaded region in which it does not. E, Experimental design: Whole-cell recordings were made from an SST interneuron (blue) before (baseline) and after bath application of the INaP current activator, veratridine (magenta). F, Example trace of INaP current before (black), after application of veratridine (1 μm; magenta) followed by application of TTX (500nM: gray). G, H, Example traces of a WT SST interneuron before (G; black) and after (H; magenta) bath application of INaP current-activator veratridine (1 μm). I, Shift in depolarization block threshold in response to bath-applied veratridine at 100 nm (n = 8, 3 mice), 500 nm (n = 8, 3 mice), and 1 μm (n = 7, 3 mice). **p < 0.01, ***p < 0.001, comparing before and after treatment with veratridine (paired t test).
