Figure 4.
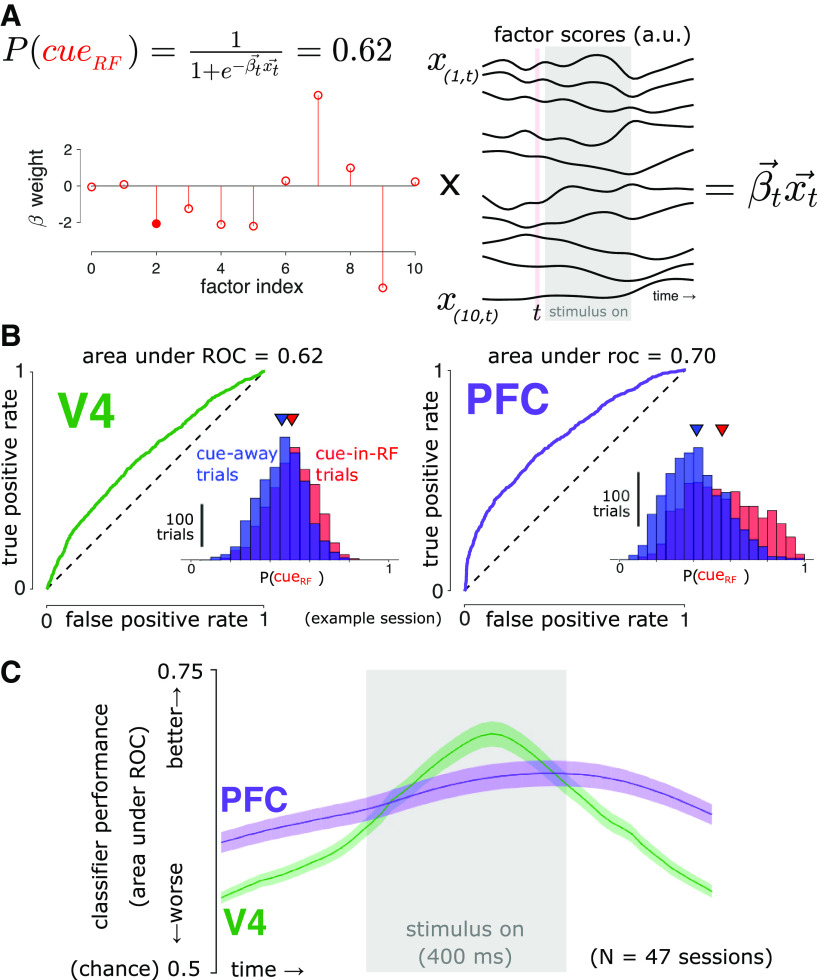
Decoding attention state. A, At each time point (t), we found the optimal coefficients () for the logistic regression equation shown, where is a vector of GPFA scores. We then estimated the attention state, P(cueRF), in a cross-validated manner. The filled marker indicates the example PFC factor illustrated in Figure 3B. B, Using the same representative session and time point indicated in Figure 3B, we estimated the probability that each trial came from the cue-in-RF condition, P(cueRF). Inset, Distributions of P(cueRF) values for that time point. Triangles indicate the distribution means. By varying the classification threshold, we constructed receiver operating characteristic curves to assess how separated the cue-in-RF and cue-away distributions were. Both brain areas carried predictive information about the cue condition. C, Decoder performance (cross-validated area under the receiver operating characteristic curve). Logistic regression models trained on population activity from each brain area performed significantly better than chance (0.5) at predicting which location was cued during the task at all time points (t test, p < 0.05, Bonferroni corrected). This indicates that population activity in both brain areas encoded information about the attention state at all times. Shading represents ±1 SEM, N = 47 sessions across two subjects.

