Figure 5.
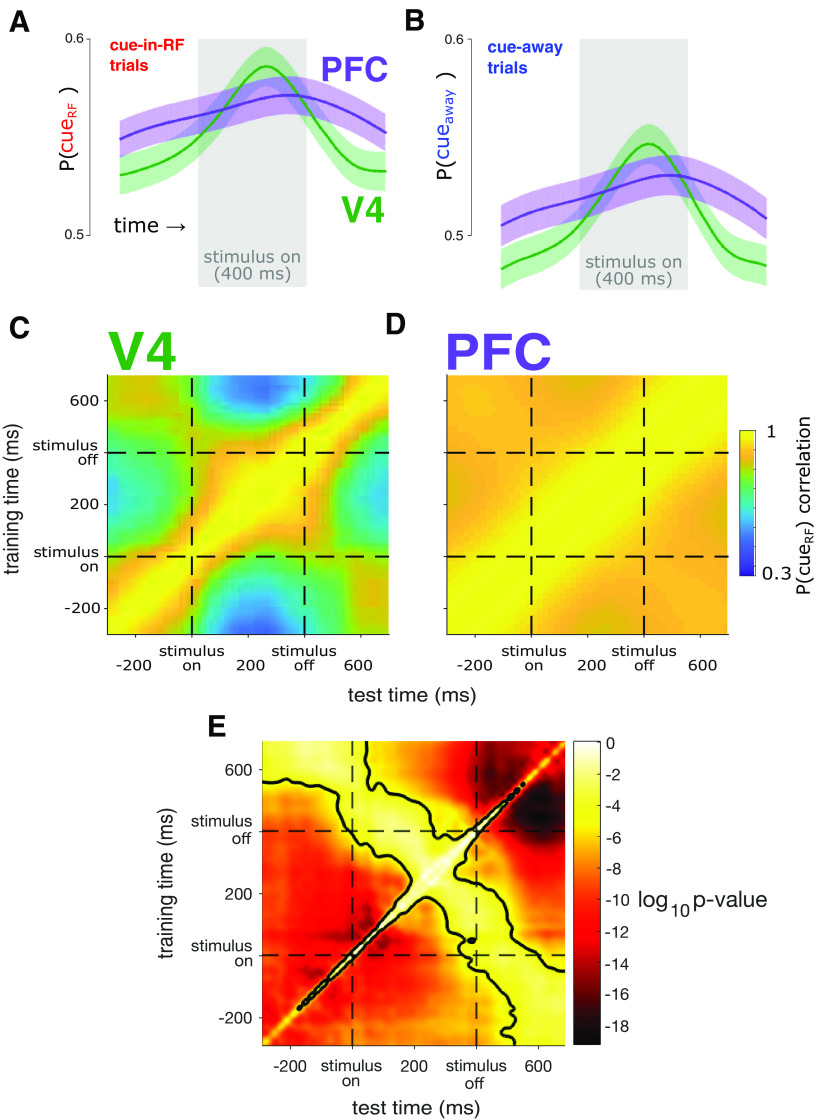
The population code for cue condition is more dynamic in V4 than in PFC. A, Average probability that the RF was cued [P(cueRF)], estimated from cue-in-RF trials. The average prediction was more dynamic over time in V4 (green) than in PFC (purple). The gray rectangle indicates the time the stimulus was present. Shading represents ±1 SEM, N = 47 sessions across two subjects. B, Same conventions as in A but for the average probability that the cue was away from the RF [P(cueaway)] using population activity on the cue-away trials. C, Decoding stability. In V4, decoded P(cueRF) values were highly correlated only when using decoders trained at nearby time points, which indicates a dynamic code for attention. D, In PFC, decoded P(cueRF) values were highly correlated when using decoders trained across a much wider range of time points, indicating a stable code. E, Statistical comparison of C and D. For each observed P(cueRF) correlation value, we tested whether the correlation was significantly different between the two brain areas (dependent-samples t test, N = 47 sessions, α = 0.05, Bonferroni corrected for the number of time point pairs). P(cueRF) values are significantly more correlated across a wider range of time points in PFC than in V4. The black contour indicates the significant p value threshold of p = 0.05.

