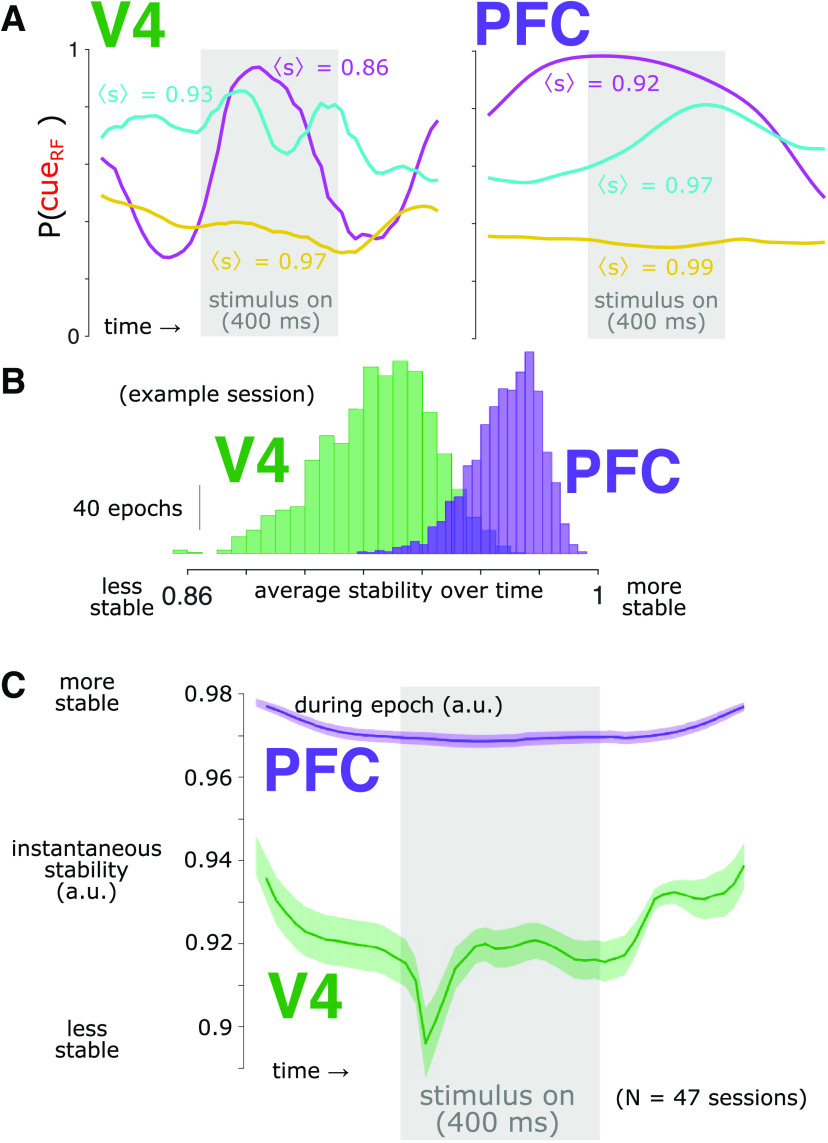
Figure 6.
Decoded attention state is more stable for PFC than for V4. A, Single-trial attention prediction examples from a representative session. Within a single trial, the P(cueRF) varied. To quantify this variation, we calculated the stability (s); a value of s = 1 indicates perfect stability, and a value of s = 0 indicates the expected stability if time points were independent (see above, Materials and Methods). The trials shown are the trial with the greatest average stability over time [, gold], the trial nearest the median [, cyan] and the trial with the nearest zero (magenta) for each brain area. B, Distributions of average stability during each peristimulus epoch (−300 ms to 700 ms relative to stimulus onset) for V4 (green) and PFC (purple). Same session as in A. C, The prediction stability was greater in PFC (purple) than in V4 (green) at all time points (t test, p < 0.05, Bonferroni corrected). This included prestimulus time points, indicating that differences in P(cueRF) stability were not trivially because of, for example, different dynamics of stimulus responsiveness, (Note also that although stability dropped transiently in V4 around stimulus onset, in general, stability in V4 was at similar levels during spontaneous and stimulus-evoked activity, indicating stability was not trivially related to overall activity levels.) The gray rectangle indicates the time the stimulus was present. Shading represents ±1 SEM, N = 47 sessions.

