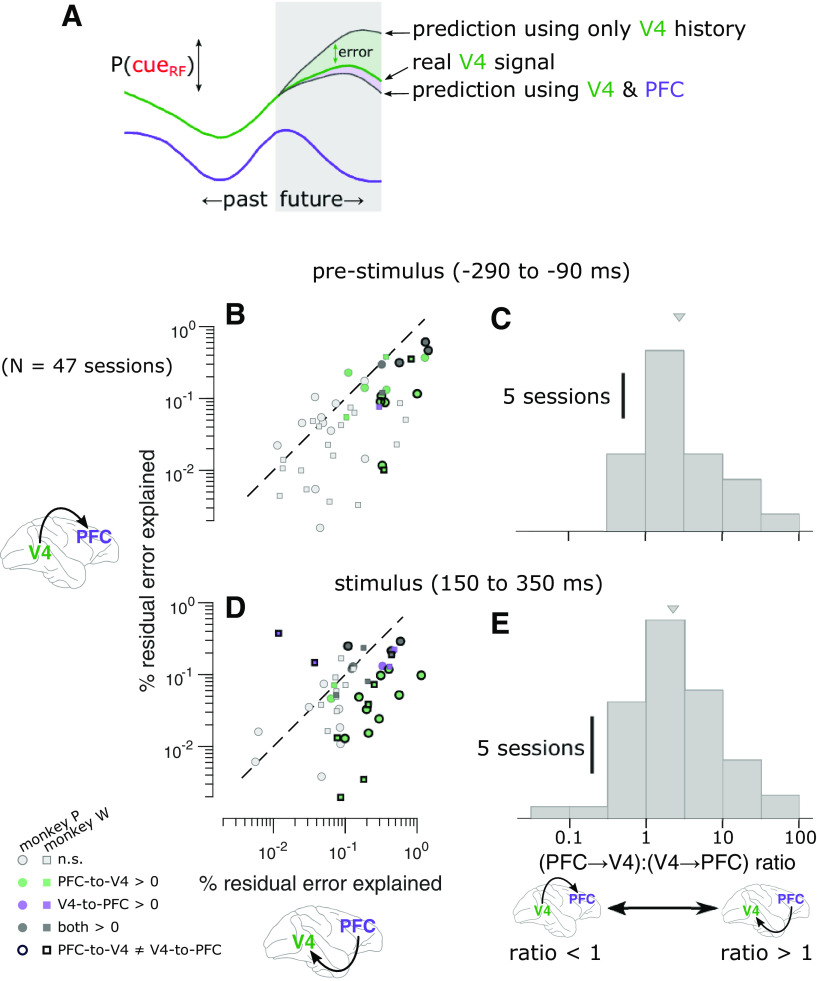
Figure 7.
Between-area prediction of attention states is better in the PFC-to-V4 direction than in the V4-to-PFC direction. A, Schematic of GCI analysis. To test for GCI in the PFC-to-V4 direction, we measured the reduction in error predicting the future P(cueRF) in V4 from the past history of both brain areas compared with when predicting from the past history of V4 alone. We also measured the reduction in error when predicting the future P(cueRF) in PFC from the past history of both brain areas compared with when predicting from the past history of PFC alone. B, GCI in each direction during the prestimulus period. The value along each axis is the reduction in error in predicting P(cueRF) with both brain areas, compared with one brain area alone. Each marker represents a session (green, PFC-to-V4 significantly greater than zero for individual session, p < 0.05, permutation test, Bonferroni corrected; purple, V4-to-PFC significant; dark gray, both significant; light gray, neither significant). Points lie below the unity slope line on average, indicating that adding PFC to V4 when predicting the upcoming P(cueRF) in V4 is more helpful than adding V4 to PFC when predicting the upcoming P(cueRF) in PFC. That is, the P(cueRF) in PFC explained more residual error about the future P(cueRF) in V4 than vice versa. Symbols with a thick black border indicate sessions with a significant difference between V4-to-PFC GCI and PFC-to-V4 GCI (p < 0.05, permutation test, Bonferroni corrected). C, Asymmetry in GCI during the prestimulus period. Values >1 indicate greater GCI in the PFC-to-V4 direction than in the V4-to-PFC direction (median, 2.39×, t(46) = 5.80, p = 5.79 · 10– 7). D, GCI in each direction during the stimulus response. The P(cueRF) in PFC explained more residual error about the future P(cueRF) in V4 than vice versa (points below the diagonal). E, Asymmetry in GCI during the stimulus response. Values >1 indicate greater GCI in the PFC-to-V4 direction than in the V4-to-PFC direction (median, 2.31×, two tailed t(46) = 4.27, p = 9.68 · 10– 5). Triangles indicate distribution means.

