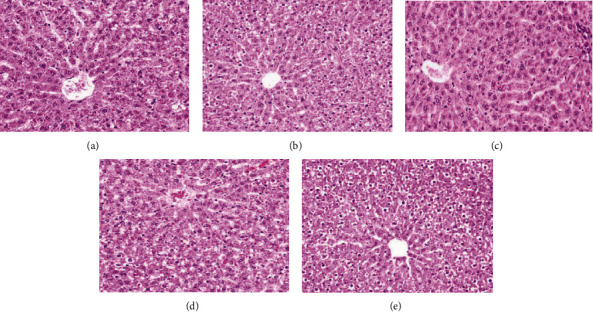
Figure 2.

Effect of PM2.5 exposure on liver damage. (a–e) Representative images of liver hematoxylin and eosin staining in the control group (a), 0.75 mg/kg PM2.5 group (b), 2.5 mg/kg PM2.5 group (c), 5 mg/kg PM2.5 group (d), and 10 mg/kg PM2.5 group (e). Original magnification, 200x.
