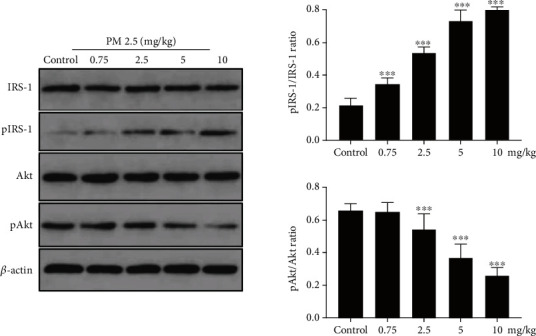
Figure 5.

Effect of PM2.5 exposure on the phosphorylated and total protein expression changes in the rat liver. (a–d) Representative western blotting bands of IRS-1 (a), p-IRS-1 (b), Akt (c), and p-Akt (d) proteins. (e) Statistical analysis. Values are shown as the mean ± standard error of 12 rats/group. ∗p < 0.05, and ∗∗p < 0.01.
