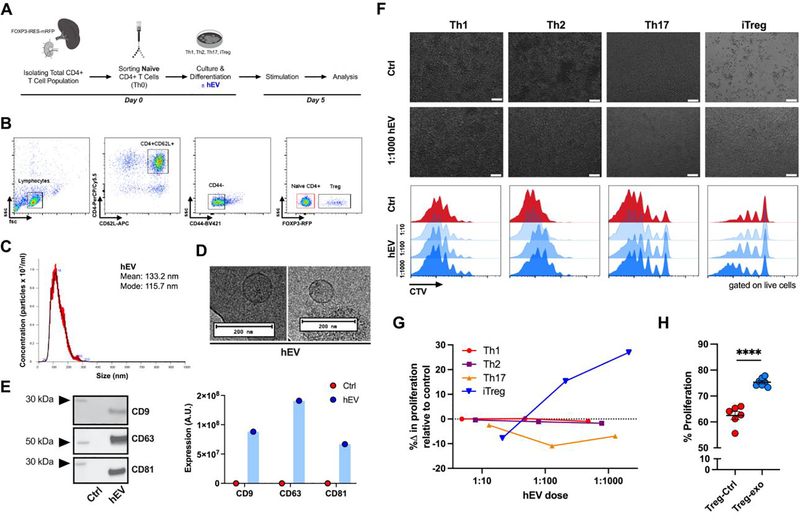
Figure 1. Dose-dependent and cell-specific response in proliferation after hEV exposure.
A. Experimental outline for in vitro T cell analysis: isolation of the total CD4+ T cell population from FOXP3 reporter mice, enrichment of naïve CD4+ T cells, and subsequent differentiation into conventional effector T cells (Th1, Th2, Th17) and induced regulatory T (iTreg) cells. Following differentiation, cells were cultured with either vehicle or human hEVs. B. Sorting strategy for naïve CD4+ T cells (red gate). C. Particle concentration and mean and mode sizes of hEVs by nanoparticle tracking analysis. D. Transmission electron microscopy images of hEVs. Bars, 200 nm. E. Analysis of EV markers, including CD9, CD63, and CD81, by western blot (n=1/group). F. Proliferation of effector T cells and iTreg cells after exposure to vehicle or varying doses of hEVs (ratio expressed as cell-to-EV). Top two rows are light microscopy images of the cells. Bars, 100 μm. Bottom rows represent quantification by flow cytometry using dilution of the proliferation dye, CellTrace Violet (CTV). G. Quantification of the change in the rate of proliferation with increasing doses of hEVs relative to vehicle control. %Δ in proliferation = [(proliferation with hEV – proliferation with vehicle)/proliferation with vehicle] x 100. H. Proliferation of iTreg cells following exposure to hEVs (cell-to-EV ratio of 1:1000) and vehicle control (****P < 0.0001, n=6–7/group, two-tailed Student’s t-test). Data are mean ± SEM.

