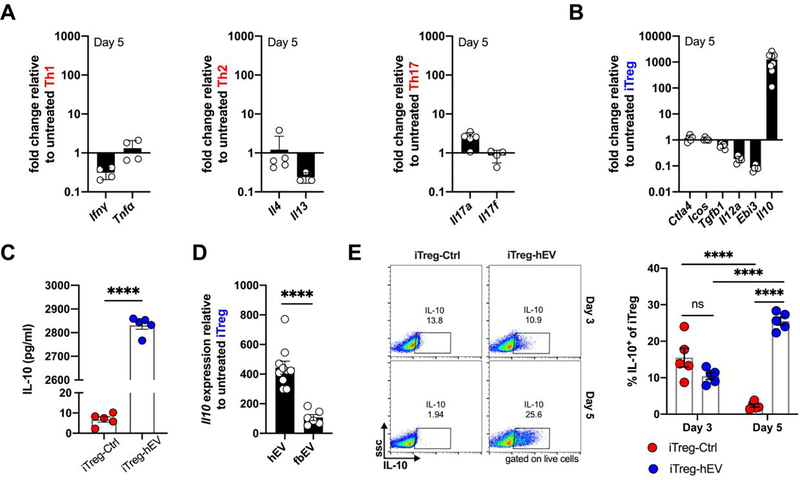
Figure 2. hEVs augment production of IL-10 by iTreg cells.
A. Expression of signature cytokines by human hEV-primed effector T cells, including Ifng and Tnfa by Th1 cells, Il4 and Il13 by Th2 cells, and Il17a and Il17f by Th17 cells, relative to vehicle-primed cells (n=3–5/group). Data are mean ± SD. B. Quantification of Treg markers and cytokines expressed by iTreg-hEV relative to iTreg-Ctrl (n=5–8/marker). Data are mean ± SD. C. Protein concentration of IL-10 quantified by ELISA in the culture media of iTreg-hEV and iTreg-Ctrl (****P < 0.0001, n = 5/group, two-tailed Student’s t-test). Data are mean ± SEM. D. Expression of Il10 by iTreg cells on day 5 following exposure to hEVs or human dermal fibroblast EVs (fbEVs), relative to iTreg-Ctrl (****P < 0.0001, n = 6–10/group, two-tailed Student’s t-test). Data are mean ± SEM. Gene expression data analyzed using the 2−ΔΔCt method after normalization against Gapdh expression and vehicle controls. E. Representative flow cytometry plots and quantification of intracellular IL-10 staining, as percent of total iTreg cells on days 3 and 5 (ns = 0.1539 between iTreg-Ctrl and iTreg-hEV on day 3; ****P < 0.0001 between iTreg-Ctrl on day 3 and iTreg-Ctrl on day 5; ****P < 0.0001 between iTreg-hEV on day 3 and iTreg-hEV on day 5; ****P < 0.0001 between iTreg-Ctrl on day 5 and iTreg-hEV on day 5; n=5/group, two-way ANOVA with Sidak’s multiple comparisons test). Data are mean ± SEM.

