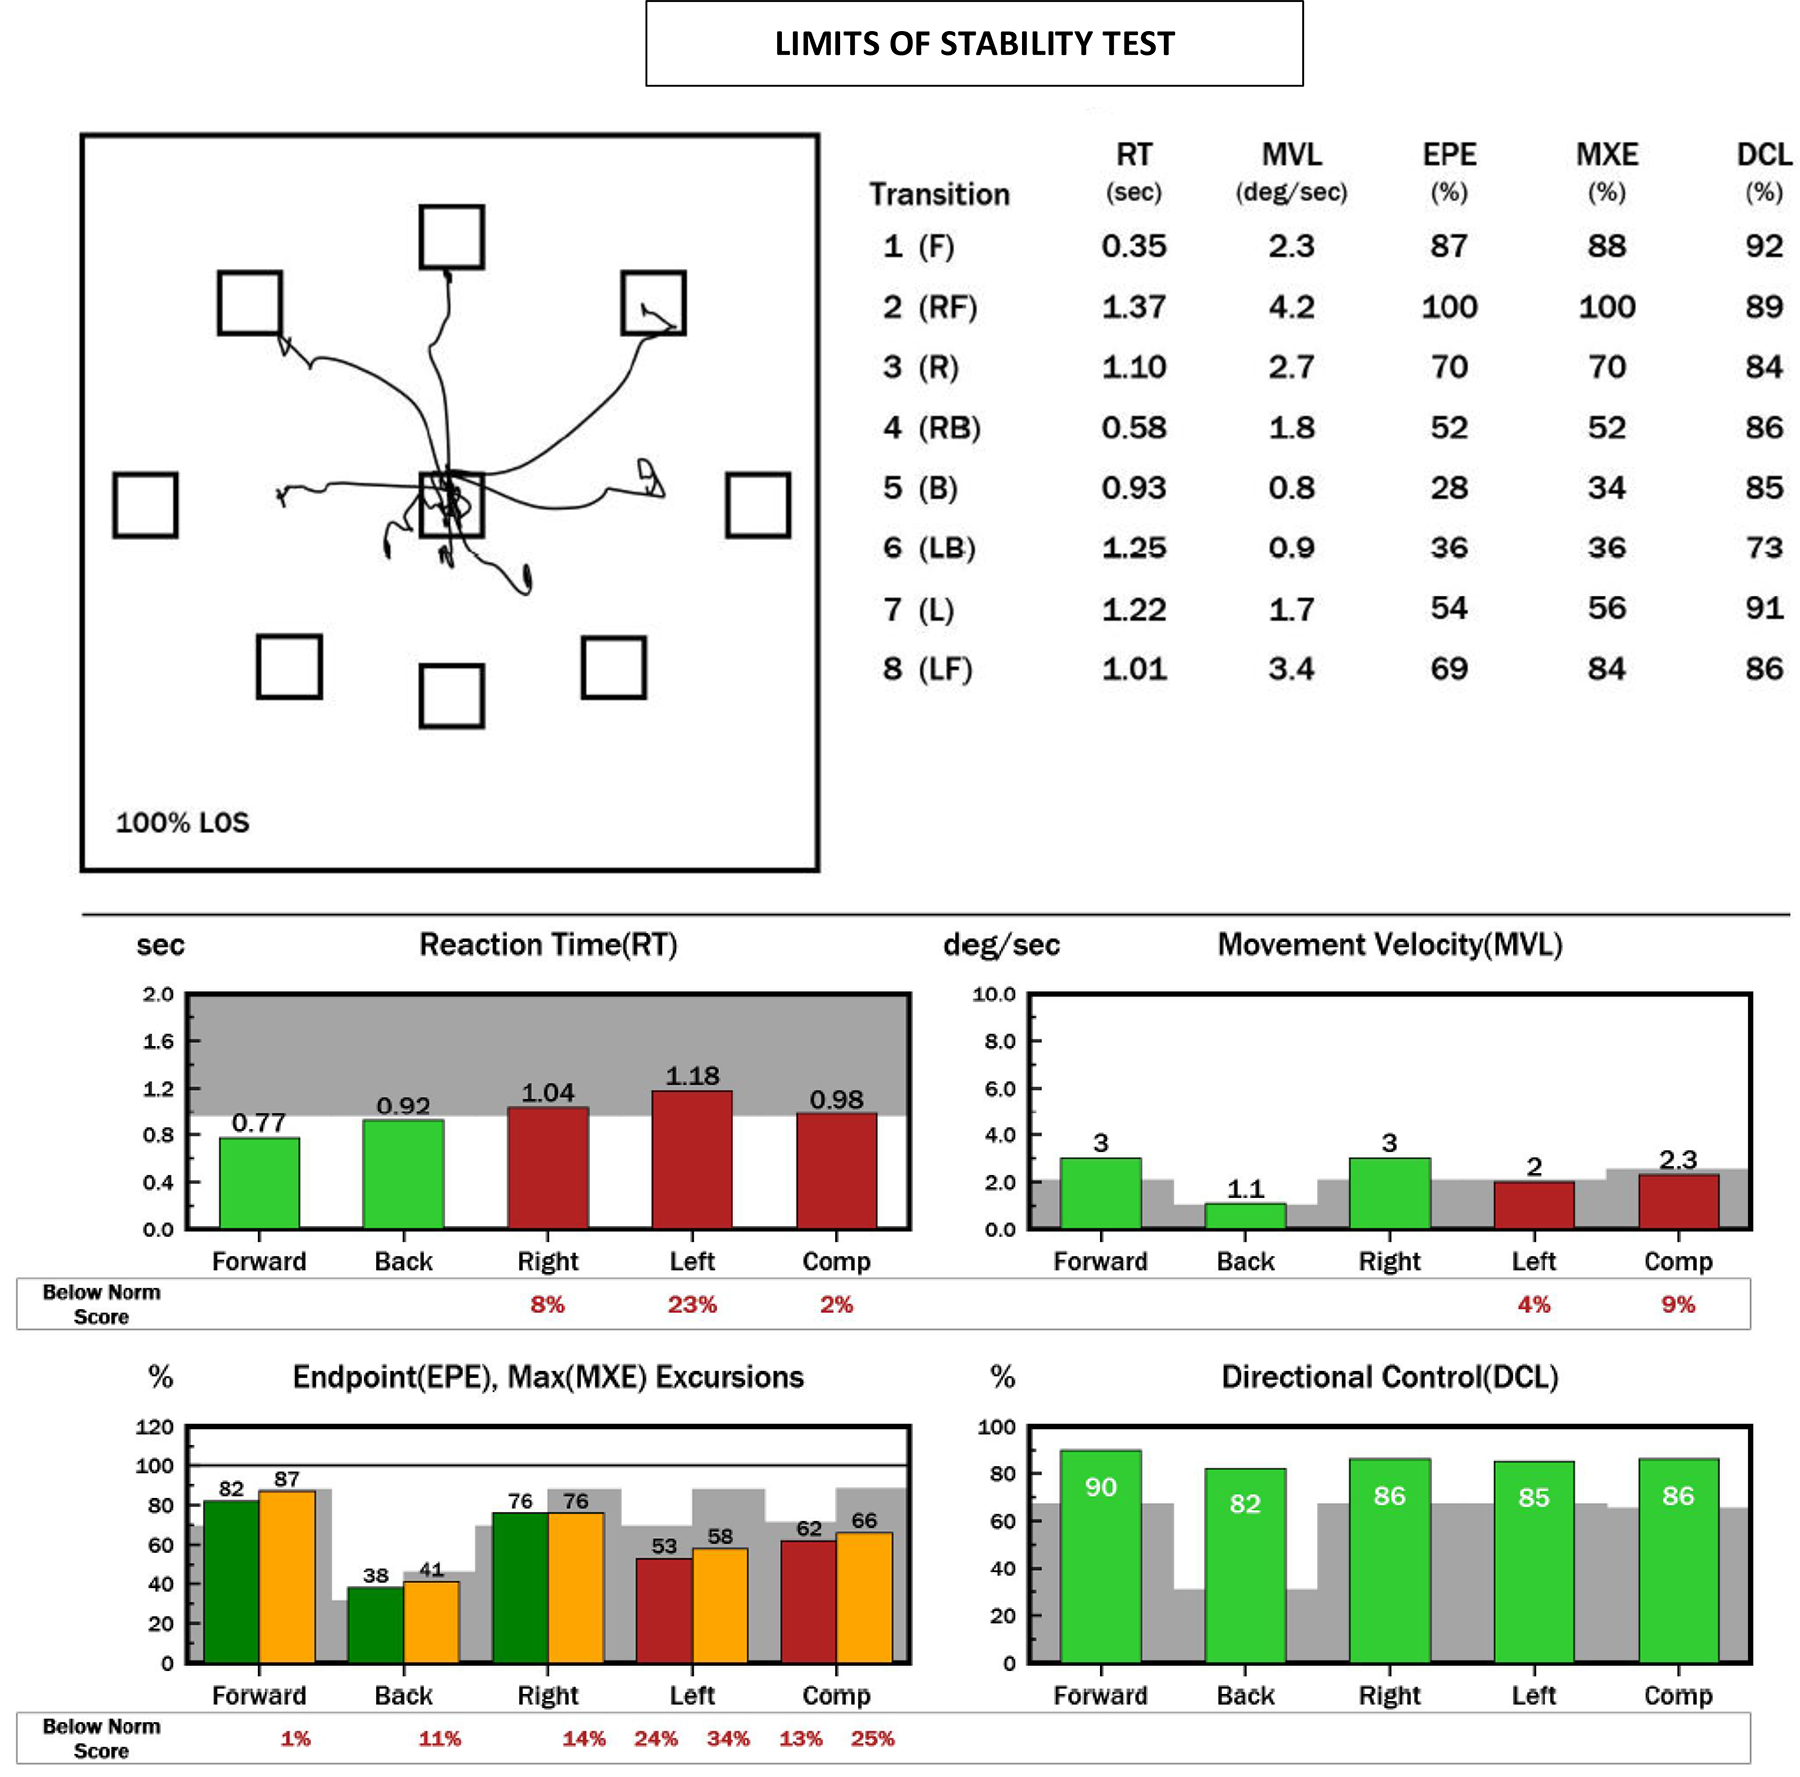
Figure 1. Representative LOS test report.

NeuroCom report of the LOS test for a Breacher participant. In this test the patient is required to purposefully lean his body toward targets displayed in 8 directions at 100% of his theoretical limits of stability. The top left plot shows this patient’s center of gravity tracings during the leaning task. During testing, the patient starts in the center box and leans toward each target in a clockwise manner. Ideally, the tracing should look like a star, with 8 lines radiating from the center to each target. The top right are scores on each LOS parameter for each target. Bottom bar plots represent this participant’s scores on the forward, back, right, left directions and composite scores (all directions). Red and yellow bars represent abnormal scores and green bars represent normal scores. Gray shading represents abnormal area that is 2 standard deviations from normative mean values. The numbers underneath abnormal bars represent how much (percentage) that particular score was below normal. This participant scored abnormal on the composite scores for reaction time, movement velocity, endpoint and maximum excursions. Note: F=forward, RF=right forward, R=right, RB=right backwards, B=backwards, LB=left backwards, L=left, LF=left forwards, in reference to the 8 target placements.
