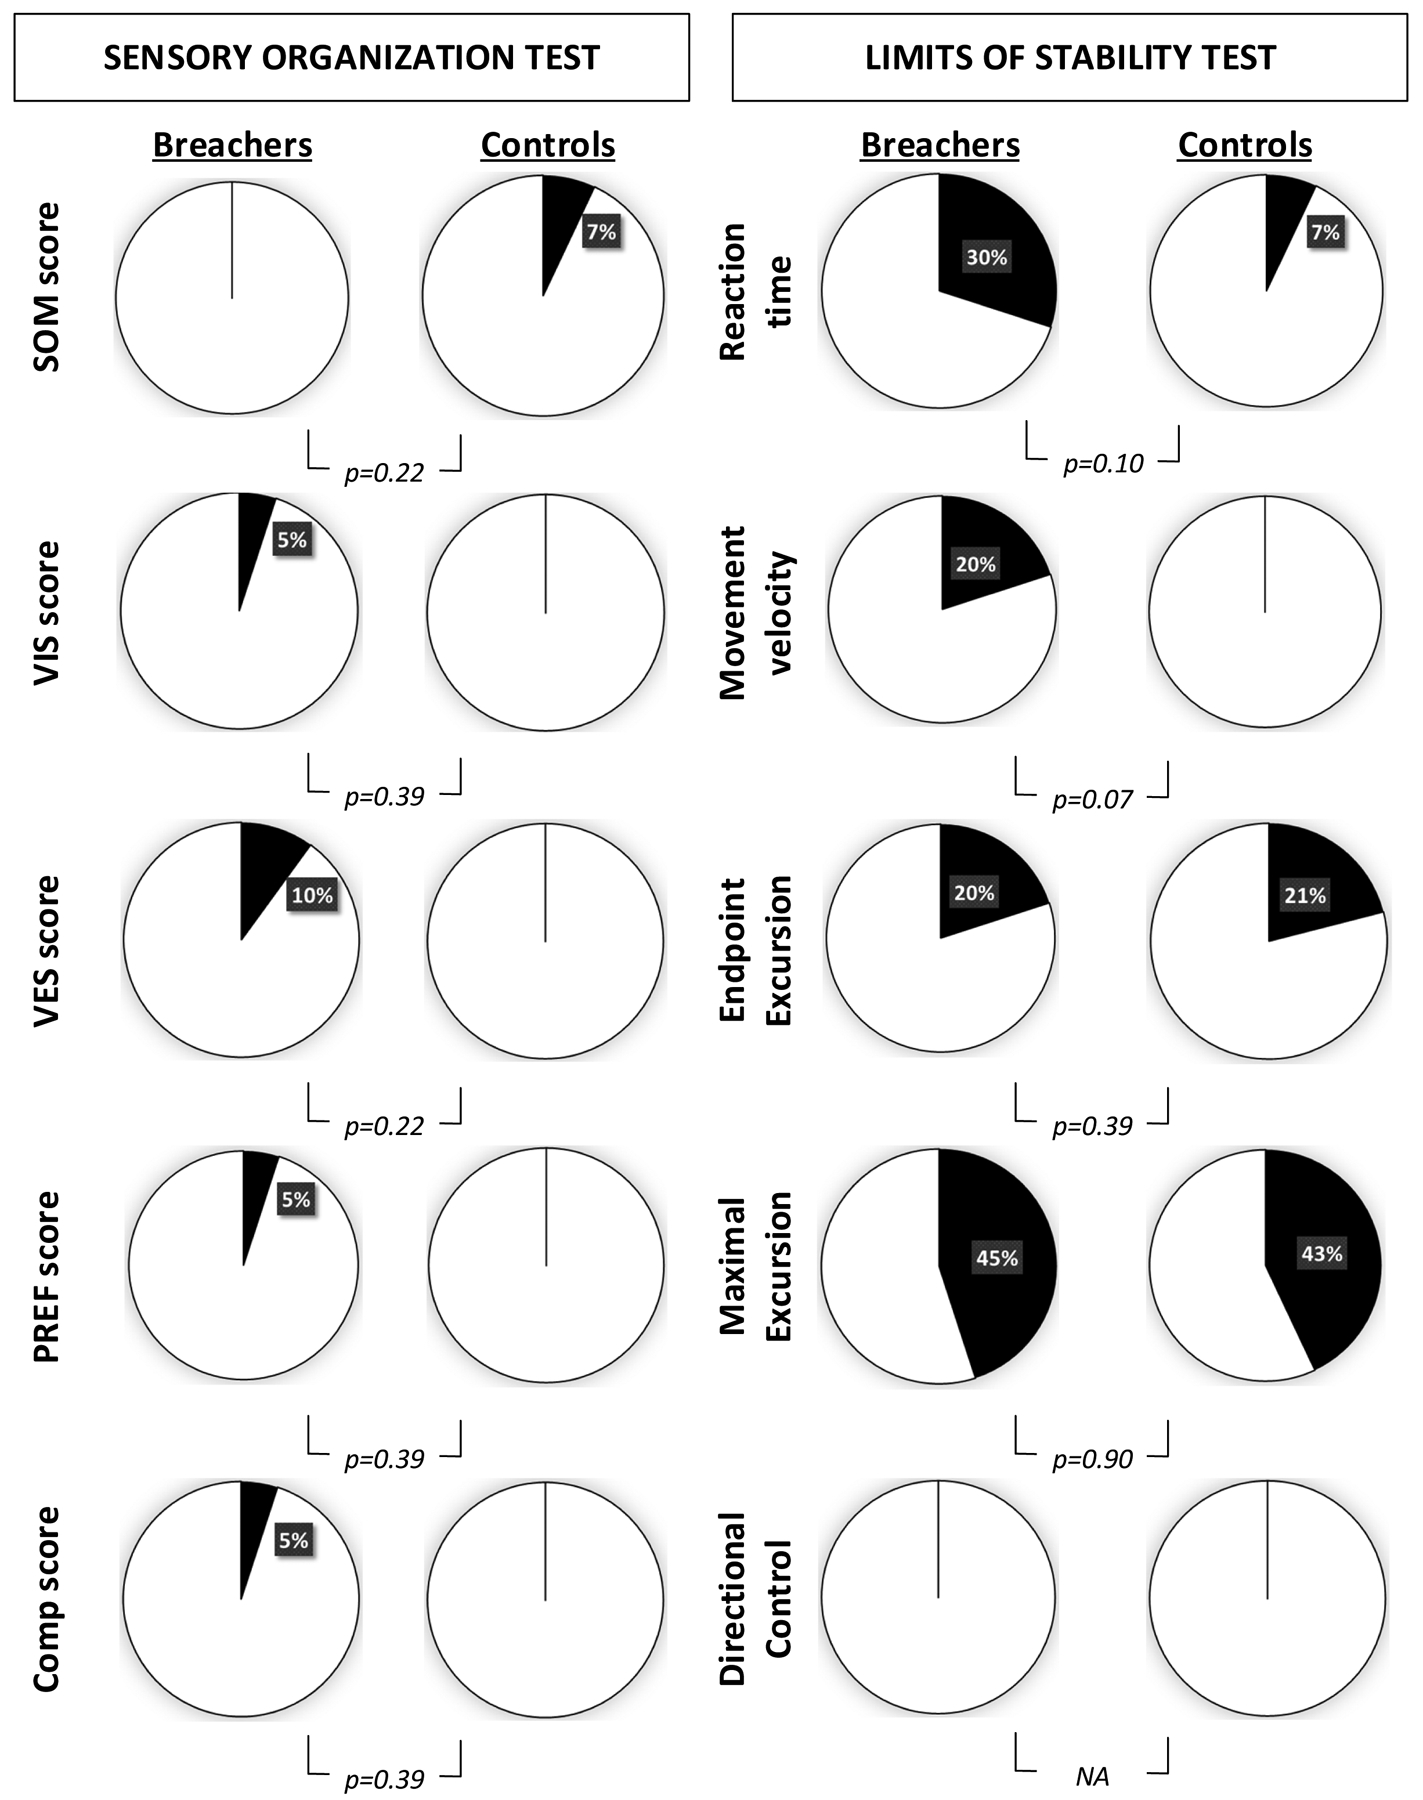
Figure 2. Percentage of abnormal Sensory Organization and Limits of Stability test scores.

Pie charts show percentage of abnormal scores (black on the charts) of Breachers and controls under each test. Scores were considered abnormal if they were more than 2 standard deviations away from the mean of the NeuroCom normative database. Chi-square p values are presented for each comparison and there no significant differences between groups on the percentages of abnormal scores.
