

Abstract
Subclinical hypothyroidism and low T3 syndrome are commonly associated with an increased risk of cardiovascular disease (CVD) and mortality. We examined effects of T3 on T-tubule (TT) structures, Ca2+ mobilization and contractility, and clustering of dyadic proteins. Thyroid hormone (TH) deficiency was induced in adult female rats by propyl-thiouracil (PTU; 0.025%) treatment for 8 weeks. Rats were then randomized to continued PTU or triiodo-L-thyronine (T3; 10 ug/kg/d) treatment for 2 weeks (PTU+T3). After in vivo echocardiographic and hemodynamic recordings, cardiomyocytes (CM) were isolated to record Ca2+ transients and contractility. TT organization was assessed by confocal microscopy, and STORM images were captured to measure ryanodine receptor (RyR2) cluster number and size, and L-type Ca2+ channel (LTCC, Cav1.2) co-localization. Expressed genes including two integral TT proteins, junctophilin-2 (Jph-2) and bridging integrator-1 (BIN1), were analyzed in left ventricular (LV) tissues and cultured CM using qPCR and RNA sequencing.
The T3 dosage used normalized serum T3, and reversed adverse effects of TH deficiency on in vivo measures of cardiac function. Recordings of isolated CM indicated that T3 increased rates of Ca2+ release and re-uptake, resulting in increased velocities of sarcomere shortening and re-lengthening. TT periodicity was significantly decreased, with reduced transverse tubules but increased longitudinal tubules in TH-deficient CMs and LV tissue, and these structures were normalized by T3 treatment. Analysis of STORM data of PTU myocytes showed decreased RyR2 cluster numbers and RyR localizations within each cluster without significant changes in Cav1.2 localizations within RyR clusters. T3 treatment normalized RyR2 cluster size and number. qPCR and RNAseq analyses of LV and cultured CM showed that Jph2 expression was T3-responsive, and its increase with treatment may explain improved TT organization and RyR-LTCC coupling.
Keywords: Transverse-tubules, STORM, Ca2+, Junctophilin-2, Thyroid hormone, Ryanodine receptors
1. Introduction
A consistent clinical finding in patients with heart failure (HF) is thyroid hormone dysfunction resulting in low serum triiodothyronine (T3) and/or low thyroxine (T4) with elevated serum thyroid-stimulating hormone (TSH) levels.1, 2 In patients with preexisting HF, the presence of subclinical hypothyroidism or low-T3 syndrome has been associated with more severe symptoms and poor prognosis, often leading to increased risk of cardiovascular and all-cause mortality.2–9 The American College of Cardiology Foundation/American Heart Association Guideline for the management of HF recommends thyroid function testing, specifically serum TSH, in the initial diagnostic evaluation of patients presenting with HF in recognition that thyroid dysfunction can be a primary or contributory cause of HF.10 While correction of overt thyroid dysfunction in HF patients is recommended, treatment recommendations of subclinical hypothyroidism or low-T3 syndrome have not been made. However, clinical trials restoring TH function in patients with HF or after myocardial infarction (MI) have shown significant improvements in ventricular remodeling and contractile function.11–15
Thyroid hormones, specifically bioactive T3, function primarily by regulating transcription of cardiac genes encoding ion channels, contractile and structural proteins.16, 17 Studies have documented that THs hormones promote transverse tubule (TT) development in induced pluripotent stem cells (iPSC)-derived cardiomyocytes and engineered heart tissue, thus promoting functional excitation-contraction (EC) coupling and dyadic organization of L-type Ca2+ channels (LTCC) and ryanodine receptors (RyR2).18, 19 Our recent studies have shown that low-dose T3 treatment of rats exhibiting heart failure induced by MI, attenuated TT disorganization observed in untreated HF animals, and that T3 normalized Ca2+ transients and contractility.20 T3 treatment also normalized expression of bridging integrator-1 (BIN1) and junctophilin (Jph2), two structural proteins that function to bridge SR and TT to produce functional dyads and efficient EC coupling.21, 22 Down-regulation of these proteins has been implicated in TT disorganization in HF, while Jph2 gene therapy has been shown to normalize Ca2+–induced Ca2+ release (CICR).23–25 High resolution cell imaging has confirmed that remodeling of TTs in HF produces less synchronous and slower Ca2+ release leading to reduced myocyte contractile dynamics.26–28 Adverse remodeling of TTs in failing human hearts has also been recently reported.29, 30 In these failing hearts, the remodeled TTs appear dilated and decreased in number with greater distances between SR and TT resulting in reduced CICR.31–33
In light of the clinical significance of TH dysfunction in heart disease, the present study was undertaken to interrogate the effects of T3 treatment on TT organization, dyadic RyR2-Cav1.2 clusters, Ca2+ transients and contractile responses in a model of thyroid hormone deficiency.
2. Materials and Methods
2. 1. Animal model and treatment protocols
All animals were treated in accordance with the National Institutes of Health Guidelines for the Use and Care of Laboratory Animals (HHS Pub. No.85–23). The Institutional Animal Care and Use Committee of the New York Institute of Technology College of Osteopathic Medicine approved the study protocols. Thyroid hormone deficiency was induced in female Sprague-Dawley rats (220 – 250 g) (Envigo RMS, Inc., Indianapolis, IN) by ingestion of 6-propyl-2-thiouracil (0.025% PTU; SigmaAldrich, St. Louis, MO) dissolved in drinking water provided at ad libitum for 8 weeks. After 8 weeks of PTU treatment, rats were randomly assigned to continued PTU treatment (PTU group) or received triiodo-L-thyronine (T3; SigmaAldrich; St Louis, MO) in PTU-containing drinking water for an additional 2 weeks (PTU+T3 group). Stock T3 was prepared by dissolving in an ethanol/glycerol solution and then diluted in drinking water at a concentration calculated to deliver 10ug/kg/d based on weekly measurements of body weight and water consumption as we previously published 20, 34. Control rats (euthyroid, EU group) consumed untreated water. All rats were housed under controlled temperature conditions, 12 hr light/dark cycles, with food and water available ad libitum. Separate animals were required for isolation of ventricular myocytes and for tissue analysis, and the total number of animals per treatment group for each analysis is indicated in the text.
2. 2. Echocardiographic and hemodynamic measurements
After the 10-week study period, cardiac function was recorded in lightly anesthetized animals (isoflurane at 3% induction, 1.5% maintenance). Echocardiograms (GE Vivid 7-Dimension Ultrasound, Horten, Norway) using a M12 L linear array transducer (5–13 MHz) were obtained from LV short-axis views and analyzed in M-mode to measure LV structural and functional parameters in systolic and diastolic phases. Subsequently, LV hemodynamics were recorded by catheterization using a 1.9F pressure catheter (Transonic SciSense, Canada) advanced through the right carotid artery into the LV to record heart rate (HR), LV end diastolic pressure (LVEDP), maximum developed LV pressure (max LVP) and changes in pressures over time (±dP/dt). Data were recorded until hemodynamic parameters reached steady state (~20 min.), at which time ~100 cardiac cycles were used for calculations. Data were acquired and analyzed using LabScribe software (iWorx Systems, Dover, NH).
2. 3. Serum thyroid hormone assays
Following cardiac functional recordings, a left thoracotomy exposed the heart and blood was obtained from the right ventricle. Serum was separated, aliquoted and stored at −20°C until it was analyzed for total T3 and total T4 using ELISA kits following the manufacturer’s recommendations (Monobind Inc., Lake Forest, CA).
2. 4. Isolation of left ventricular myocytes
After blood collection, the aorta was clamped above its entry into the heart, and a 5 mM EDTA solution was injected slowly into the right and left ventricles to clear the coronary vessels. The heart was removed and the aorta was mounted onto a perfusion apparatus (Radnoti LLC, Covina, CA) for retrograde perfusion with a modified Ca2+-free Krebs-Henseleit buffer (KHB) containing collagenase (0.18 g/50 ml KHB; Worthington Biochemical Corp., Lakewood, NJ). Enzymatic digestion occurred at 37°C for ~30 min. and then terminated with EDTA-containing KHB. The atria and right ventricle were removed, and the left ventricle was gently teased apart to isolate cardiomyocytes. Calcium was reintroduced to the isolated myocytes over a 20 min. period, after which the myocytes were either maintained in Tyrode’s buffer for immediate IonOptix analysis or plated onto laminin-coated coverslips or 8-well glass-bottom chamber slides (Ibidi, GmbH) in medium M199 containing 10% FBS and 2,3-butanedione monoxime (BDM, 10 mM). Myocytes were allowed to adhere for 1 to 2 hours prior to staining or fixation for microscopy.
2. 5. IonOptix analysis of calcium transients and contractility
Video-based edge detection of sarcomere length changes coupled to the capture of fluorescence signals in response to electrical field stimulation allowed simultaneous recordings of cardiomyocyte contractile cycles and Ca2+ transients. Fura2, a ratio-metric dye, was used to measure intracellular free Ca2+ by capturing its fluorescence signals emitted at excitation wavelengths of 340 and 380 nm and expressed as fluorescence ratio at 340/380 nm. Lyophilized Fura2/AM (Molecular Probes, ThermoFisher Scientific, Waltham, MA) was reconstituted in DMSO to a stock concentration of 1 mM, aliquoted for single use and stored at −20°C. Isolated ventricular myocytes incubated in Tyrode’s buffer containing 1.8 mM Ca2+ were loaded with Fura2/AM (1μM final) for 5 min. at room temperature, then washed and placed in a perfusion chamber mounted on IonOptix Motic® AE31 inverted microscope and visualized under a 40X objective. Only rod-shaped myocytes with defined cell edges, no blebs or cauliflower-shaped cell ends, quiescent when unstimulated, and exhibiting stable contractility when stimulated for ~5 min. were included in the analysis. Cells were field stimulated at 1 Hz (4 V) and after displacements reached steady state, contractile cycles and Ca2+ transients were analyzed using the IonWizardTM v6.5 acquisition software. Data from ~25 cycles per cell and ~30 cells per heart were used to calculate average values of each parameter recorded.
2. 6. T-tubule organization imaged by confocal microscopy
As we have previously published20, live cardiomyocytes adhered to laminin-coated glass coverslips were incubated with wheat germ agglutinin-conjugated to Alexa-488 (WGA-488; Molecular Probes) (5 ug/ml in HBSS, 10 mM BDM; Gibco, Life Technologies; ThermoFisher Scientific) for 20 min. at 37°C, and then washed to remove unbound WGA-488. Cells were fixed with 4% paraformaldehyde (PFA) for 15 min., then washed and the coverslips mounted onto glass slides in Prolong™ Gold antifade reagent with DAPI (Invitrogen; ThermoFisher Scientific). Whole frozen tissue sections (5 μm) of adult rat left ventricles from all three groups were prepared using the same WGA staining protocol. Images were captured using a Nikon C2 LSC microscope under oil-immersion 60x objective with a numerical aperture (NA) of 1.35 and ~0.14 μm/pixel. Approximately 15 z-stacks (0.4 μm z-steps) were captured for each cell and ~20 cells per heart were analyzed for TT periodicity using an algorithm developed by Pasqualin et al35 to calculate the transverse organization of the TT system based on the peak amplitude in the Fourier spectrum of the image at the TT frequency, indicated as TT power. The higher the TT power value, the greater the TT organization (TTorg software is available as a plug-in on ImageJ36). Additionally as previously published20, live cardiomyocytes adhered to glass bottom 35 mm culture dishes (Mat-Tek Corp., Ashland, MA) were stained with di-8-ANEPPS (5 μM in HBSS with BDM; Biotium Inc., Fremont, CA) for 20 min. at 37°C. Live cells were imaged under oil immersion 63x objective of a DMI6000 SP5 Leica confocal microscope. Images from 3–4 z-stacks per cell were captured (5–10 cells/heart), and the longitudinally- (LE) and transversely-oriented (TE) tubules were analyzed for density and regularity using AutoTT, an automated program developed by Guo and Song.37
2. 7. Immunofluorescence staining and super-resolution imaging
Ventricular myocytes isolated on the same day from the 3 study groups were plated into separate wells on laminin-coated 8 well-chamber slides (Ibidi GmbH, Martinsried, Germany) to minimize differences in immunolabeling and imaging. For immunostaining, cells were fixed in 4% PFA for 20 min., then washed and permeabilized and blocked with 0.2% Triton X-100 plus 5% goat serum in PBS for 1 hr. Myocytes were co-immunolabeled by incubating overnight at 4°C with rabbit polyclonal anti-Cav1.2 (1:400; cat no. ACC-003; Alomone Labs, Jerusalem, Israel) and mouse monoclonal anti-RyR2 (1:200; cat no. MA3–916/C3–33; Invitrogen, ThermoFisher Scientific) antibodies. Secondary antibodies used were highly cross-absorbed goat anti-mouse IgG(H+L) conjugated to Alexa Fluor™−555 (cat no. A32727, 1:1000; Invitrogen) and goat anti-rabbit IgG(H+L) Alexa Fluor™−647 (cat no. A21245, 1:2000; Invitrogen). After unbound antibodies were removed by thorough washing, cells were treated with 4% PFA for 5 min., and then washed and stored in PBS at 4°C. Background fluorescence was recorded in images of cells incubated with normal mouse IgG and rabbit IgG (1:400; Invitrogen) followed by the same Alexa Fluor™ labeled secondary antibodies. Nanoimager-S super-resolution microscope (Oxford Nanoimaging Ltd. (ONi), Oxford, UK) was used with an Olympus 1.4NA 100x oil immersion super apochromatic objective. Color channel mapping was calibrated at the start of each STORM imaging session using 0.1 μm Tetraspeck beads (Thermo Fisher). During STORM imaging, the cells were incubated in blinking induction buffer (BCubed buffer; ONi) containing glucose, glucose oxidase, catalase, and beta-mercaptoethanol that was refreshed every 60 min. Although the optics of the Nanoimager S always separates light of wavelength longer than 640 nm to a different half of the sCMOS Hamamatsu orca flash 4 V3 camera chip than the half where all shorter wavelengths are directed, the recording of single molecule localization data from excitation of each fluorophore was done sequentially, first at 640 nm, then at 561 nm wavelength to avoid bleed-through between color channels or cross-excitation. Each image was acquired as a series of ~5,000 raw frames at 50 ms/frame at each wavelength.
2. 8. STORM image analysis
STORM images were analyzed using a clustering algorithm developed by Oxford Nanoimaging, Inc. using their online localization microscopy data analysis platform beta-release named CODI (https://alto.codi.bio/, releases 0.16.0 to 0.14.1; March 9th to April 28th, 2021). To classify localizations that were part of clusters within each image, one to three regions of interest (ROI) (170 μm2) were delineated, away from the cell edge and from areas visually identified as occupied by nuclei. For each ROI, initial cluster analysis of data captured individually in each channel was accomplished by hierarchical density-based spatial clustering of applications with noise (HDBSCAN) as described by Campello et al (Density-based clustering based on hierarchical density estimates; p.160–172).38 These cluster results were further refined by constraining the cluster size using minimum and maximum area thresholds of 10×103 nm2 and 100×103 nm2. Subsequently, the CODI program counted the number of localizations in each cluster, and by color channel around a set of cluster centroids and reported for downstream comparisons. A radius of 210 nm around the center point was used to count the localizations after the initial filtering step in which cluster size was constrained. The selected cluster and counting parameters were derived from our analysis of normal euthyroid cardiomyocyte images, and were based on results published by others including Asghari et al39, Baddeley et al40 and Jayasinghe et al41 in which RyR cluster area and diameter was estimated. The same selected parameters were used for analysis of images from all treatments, allowing for relative comparisons among groups. The primary measured end-points within each ROI were: (1) the number of RyR clusters per ROI, (2) the average number of localizations within each RyR cluster, and (3) the average number of localizations corresponding to Cav1.2 within each identified RyR cluster. Calculated values from all ROIs per cell were averaged, and a mean value was obtained for each parameter from all images (10–12 cells) per heart.
2. 9. Analysis of expressed genes
Real time quantitative PCR:
Frozen LV tissues were pulverized in liquid nitrogen and ~50 mg samples were homogenized in QIAzol lysis reagent using a motor-driven Teflon pestle and glass homogenizer followed by brief 2 sec bursts of a Polytron (Fisher Scientific). Total RNA was extracted using RNeasy Mini spin columns (Qiagen, Germantown, MD) and RNA concentration was measured by absorbance at 260 nm using spectrophotometry (Quickdrop, Molecular Devices; San Jose, CA). Reverse transcription of 1μg RNA used both anchored-oligo(dT)18 and random hexamer primers (Transcriptor First Strand cDNA Synthesis Kit, Roche Diagnostics Corp., Indianapolis, IN), and the resulting cDNA was used for real-time PCR (StepOnePlus, Applied Biosystems Inc., ThermoFisher) with SYBR Green technology (RT2 SYBR Green ROX qPCR). Specific primers were designed by Qiagen to amplify bridging integrator-1 (BIN1), junctophilin 2 (Jph2), ryanodine receptor (RyR2), Ca2+ channel voltage-dependent L-type alpha 1C subunit (Cacna1c; Cav1.2; LTCC), SR Ca2+-ATPase (SERCa2), phospholamban (PLN), caveolin 3 (Cav3), Na+-Ca2+ exchanger (NCX1), myosin heavy chain-α (Myh6) and myosin heavy chain-β (Myh7) cDNAs with glyceraldehyde 3-phosphate dehydrogenase (GAPDH) or Rplp1 (ribosomal protein, large P1) used for normalization of amplified PCR products in each reaction. The ΔCt calculations of PCR cycle amplifications were applied to determine relative mRNA content, and data are presented as fold change (log2-ΔCt) compared to EU values.
RNA sequencing:
Total RNA purified from LV tissue of three rats from each of the PTU and PTU+T3 treatment groups were analyzed for expressed genes using RNAseq by a commercial entity (GENEWIZ; South Plainfield, NJ). RNAseq library preparation included ribosomal RNA depletion, RNA fragmentation, random priming, first and second strand cDNA synthesis, PCR enrichment and sequencing. Sequenced reads were mapped to the Rattus norvegicus Rnor6.0 reference genome (ENSEMBL; 15,021 genes) using STAR aligner v.2.5.2b. Total mapped reads were ≥ 97% with ≥ 85% unique mapped reads. Only unique reads that fell within exon regions were counted. Differentially expressed genes between the treatment groups were identified by an adjusted p<0.05 (Benjamini-Hochberg) and absolute log2 fold change >1. Total number of significantly differentially expressed genes were 567, with 377 genes upregulated by T3 treatment of PTU rats. Data from the 567 differentially expressed genes are provided in a spread sheet in the Supplemental section.
2. 10. Adult rat ventricular myocyte cultures
Isolated adult LV myocytes from euthyroid rats were plated onto laminin-coated 35mm dishes in M199 medium containing 10% FBS. After 2 hrs, non-adherent myocytes were removed, and a subset of culture dishes were harvested for RNA isolation representing the 2h time point. The remaining dishes of cells were cultured in M199 containing charcoal-stripped 5% FBS without or with T3 (10−7 M), and the media were changed daily. Duplicate dishes from both treatment groups were harvested at 24, 48 and 72 hrs after plating and RNA was extracted (RLT cell lysis buffer, Qiagen RNeasy kit). cDNA synthesis and PCR for amplification of expressed genes Jph2, BIN1 and SERCa2 (with GAPDH as internal control) were performed as described above. LV myocytes isolated from one heart were used for a single time course experiment, and PCR values from duplicate dishes were averaged at each time point. The time course study was repeated three separate times using cardiomyocytes from three euthyroid rats, providing an n=3 per time point per treatment group.
2. 11. Statistical analysis
Data are presented as mean ± SD. Data were first assessed for normality distribution and equal variance, and statistical significance among groups was determined by one-way ANOVA followed by Tukey’s test of multiple-group comparisons using Graph Pad Prism v7.0 statistical software (Graph Pad Software, Inc., San Diego, CA). Statistical comparisons between any two groups used the unpaired non-parametric Mann-Whitney test. Statistical comparisons of differentially expressed genes between the two treatment groups that were analyzed by RNAseq used the Wald Chi-Squared test. For all statistical analysis, p < 0.05 was considered statistically significant.
3. Results
3. 1. Thyroid hormone status and LV hemodynamic analysis
PTU treatment for 10 weeks suppressed thyroid gland production of thyroxine (T4) and T3, as well as peripheral tissue T4 to T3 conversion resulting in significantly lower total serum T3 and T4 compared to EU controls (Fig. 1A,B). Using this model to isolate the effects of exogenously delivered T3, rats were continued on PTU treatment while simultaneously receiving T3 orally, resulting in continued low serum T4 while total serum T3 was normalized in the PTU+T3 group.
Figure 1. Serum T3/T4 and hemodynamic measurements.

Serum concentrations of (A) total triiodo-L-thyronine (T3) and (B) total L-thyroxine (T4). Left ventricular hemodynamic recordings showing (C) HR, heart rate; (D) LVEDP, LV end-diastolic pressure; (E) Max LVP, maximum developed LV pressure; (F) +dP/dt, first derivative of LV pressure curve during systole, and (G) –dP/dt, during diastole; (H) Tau, exponential decay time constant in diastole. Box-and-whisker plots indicate the box margins at 25th and 75th percentiles with a line drawn at the median, whiskers extend to max/min values; dots represent values from individual animals. EU, euthyroid rats; PTU, propyl thiouracil-treated rats; PTU+T3, PTU rats treated with T3; n = 7–15 rats/group. Statistical analysis used one-way ANOVA with Tukey’s test for multi-group comparisons. *p<0.05 vs EU, **0.01 vs PTU, ††p<0.0001 vs PTU and PTU+T3, ***p< 0.0001 vs EU and PTU+T3, †p< 0.05 vs EU, ‡p< 0.01 vs EU.
Heart rate (HR) was significantly decreased by 10-weeks of PTU treatment, while two weeks of T3 ingestion increased HR to euthyroid (EU) value (Fig. 1C). All hemodynamic measurements showed significant dysfunction in the rats of the PTU group compared to the EU and PTU+T3 groups (Fig. 1D-H). T3 treatment significantly improved measures of hemodynamic function, although not all parameters were completely normalized. Specifically, the rates of LV pressure development (+dP/dt) and relaxation (-dP/dt), and LV end diastolic pressure (LVEDP) were significantly improved by T3 treatment of the PTU animals; however, these measures remained significantly lower than EU values. Importantly, the T3 dose used did not induce functional hyperthyroidism that would be observed as higher than normal HR and as super-contractility measured by LV pressure recordings.
3. 2. Morphometric and echocardiographic measurements
Heart (LV+RV) weights of the PTU rats at the end of the study period were significantly less than that of EU animals (771 ± 162 mg vs 1092 ± 275 mg), while 2 weeks of T3 treatment normalized heart weights (1187 ± 71 mg). Similarly, body weights of PTU rats were lower than EU (209 ± 11 vs 282 ±13 g, respectively), and although T3 treatment increased mean body weights to 236 ± 7 g, this was still significantly lower than the EU group. Echocardiographic measurements of rats in the PTU treatment group showed highly significant changes compared to EU rats with reductions in anterior and posterior LV wall thickness, and increased LV chamber diameter in both systole and diastole resulting in significantly decreased ejection fraction and fractional shortening (Table 1). Two weeks of low-dose T3 treatment alone significantly increased these parameters to completely normal values.
Table 1.
Echocardiographic Measurements
| Euthyroid (EU) | PTU | PTU+T3 | |
|---|---|---|---|
|
| |||
| Ejection Fraction (%) | 81 ± 3 | 66 ± 1*** | 82 ± 4## |
| Fractional Shortening (%) | 44 ± 3 | 32 ± 1*** | 45 ± 5## |
| PWTd (mm) | 1.23 ± 0.03 | 1.05 ± 0.04*** | 1.23 ± 0.09## |
| PWTs (mm) | 2.14 ± 0.08 | 1.65 ± 0.03*** | 2.19 ± 0.17## |
| LVDd (mm) | 6.61 ± 0.66 | 7.12 ± 0.25* | 7.01± 0.25 |
| LVDs (mm) | 3.69 ± 0.57 | 4.86 ± 0.16*** | 3.83 ± 0.37## |
| AWTd (mm) | 1.22 ± 0.04 | 1.05 ± 0.05*** | 1.21 ± 0.07## |
| AWTs (mm) | 2.17 ± 0.09 | 1.65 ± 0.06*** | 2.13 ± 0.11## |
Values are mean ± SD. Left ventricular posterior wall thickness in diastole (PWTd) or systole (PWTs), LV diameter in diastole (LVDd) or systole (LVDs), LV anterior wall thickness in diastole (AWTd) or systole (AWTs). Statistical analysis used one-way ANOVA, post-hoc Tukey’s test for multi-group comparisons; n=9 animals for all groups;
p<0.05 vs EU,
p<0.0001 vs EU,
p<0.0001 vs PTU.
3. 3. Isolated ventricular myocyte calcium transients and contractile activity
Freshly isolated ventricular myocytes were preloaded with Fura2/AM to record Ca2+ transients and to simultaneously record sarcomere shortening and relengthening by video-based edge detection during field stimulation (4V at 1 Hz). Representative Ca2+ transients (Fratio) recorded from single myocytes isolated from PTU and PTU+T3 hearts are shown in Fig.2A with the displacements curves overlapping for comparison. Ca2+ transients from EU myocytes were similar to PTU+T3, and were omitted to better visualize the differences between PTU and PTU+T3. The corresponding contractile displacement curves (measured by changes in sarcomere length) are shown in Fig. 2B, with the curves overlapping and EU data included. Quantitation of Ca2+ transients (ratio of fluorescence intensities excited at 340/380 nm, Fratio) showed significant reductions in both maximum rise (+Vmax) and maximum fall (−Vmax) velocities in the PTU cardiomyocytes, with complete normalization to EU values after two weeks T3 treatment (Fig. 2C,D). The time at peak Ca2+ and time at 50% rise from baseline to peak and at 50% fall from peak to baseline were all significantly increased in the PTU myocytes while T3 treatment shortened these transient times to normal EU values, most likely indicative of faster SR Ca2+ release and re-uptake, although the sodium-calcium exchanger (NCX) may also contribute to this process (Table 2). The peak height of the Ca2+ transient was lower in the PTU myocytes (0.177 ± 0.053, Fratio) but this difference from EU and PTU+T3 (0.204 ± 0.012 and 0.228 ± 0.038, Fratio) was not statistically significant (Table 2). Calcium transients were also measured using Fluo-4 and these data are presented in supplemental Table S1. These Fluo-4 results largely support the measurements using Fura-2 although differences among treatments did not reach statistical significance.
Figure 2. Isolated ventricular myocyte Ca2+ transients and contractility measurements.
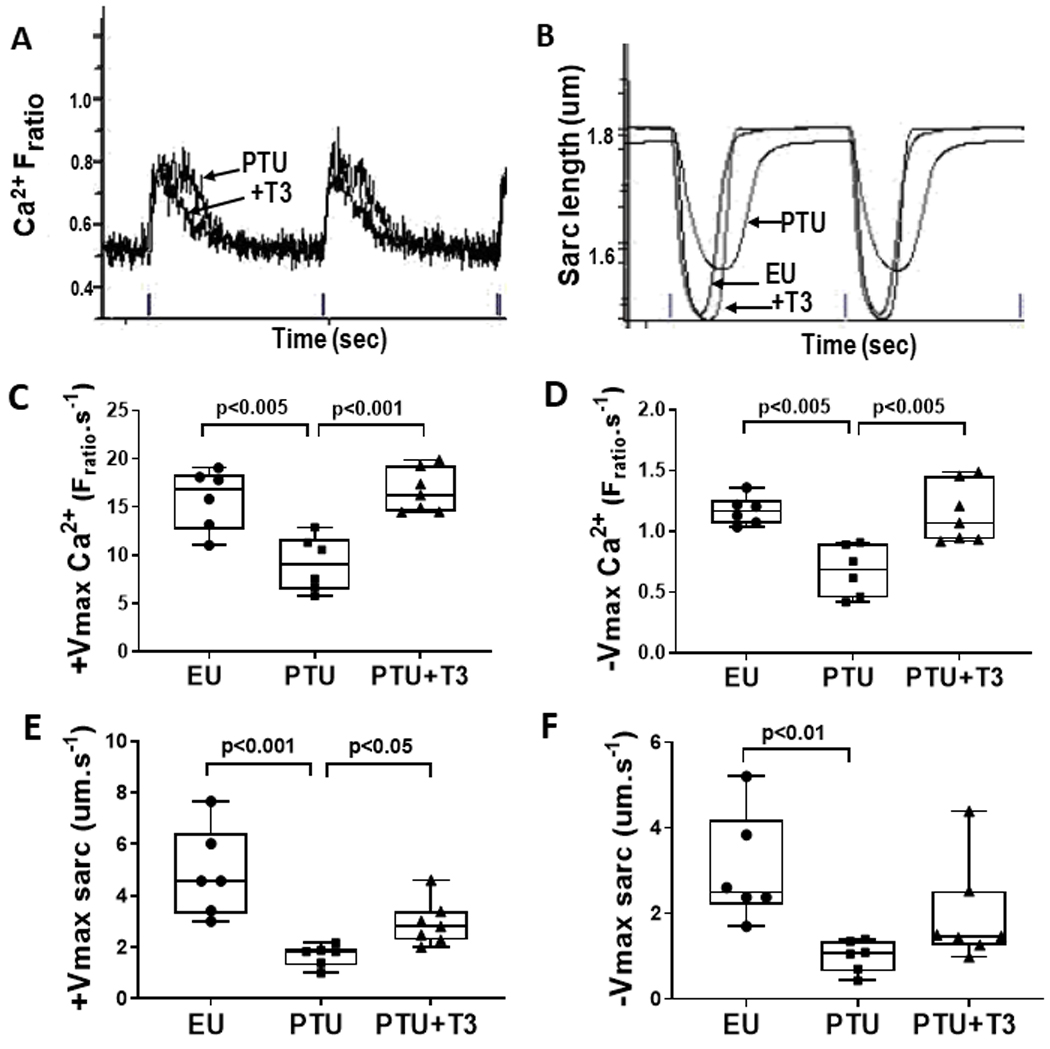
Simultaneous recordings of Ca2+ and contractile transients in individual field-stimulated (1 Hz) cardiomyocytes were captured and analyzed by the IonOptix imaging system. (A) Representative recordings of two consecutive Ca2+ transients measured by Fura2/AM loading as the ratio of fluorescence intensities excited at 340 and 380 nm (Fratio) from PTU and PTU+T3 myocytes. Ticks on x-axis are 1 Hz field stimulation markers indicating 1 sec. (B) Corresponding sarcomere shortening/relengthening displacement curves from PTU, PTU+T3, and EU myocytes with sarcomere length in μm. X-axis shows ticks at 1 Hz stimulation or 1 sec intervals. (C) Maximum velocity of rise of the calcium transient (+Vmax Ca2+) and (D) fall (−Vmax Ca2+) are shown for myocytes from individual animals in each study group. The maximum velocity of myocyte sarcomere shortening (E) (+Vmax sarc) and re-lengthening (F) (−Vmax sarc) were measured simultaneously from the corresponding cardiomyocytes. Box-and-whisker plots indicate median value, box margins at 25th and 75th percentiles, whiskers at max/min values; dots are averaged values from ~30 myocytes isolated from individual hearts; n= 6–7 rats/group. Statistical analysis used one-way ANOVA with Tukey’s multiple comparisons test; p-values between groups are indicated.
Table 2.
Analysis of isolated ventricular myocyte calcium and contractile displacement curves
| Euthyroid (EU) | PTU | PTU+T3 | |
|---|---|---|---|
| Ca2+ recordings | |||
| Ca2+ peak height (Fratio) |
0.204 ± 0.012 | 0.177 ± 0.053 | 0.228 ± 0.038 |
| Time at max Ca2+ rise velocity(s) | 0.018 ± 0.003 | 0.018 ± 0.002 | 0.018 ± 0.003 |
| Time at max Ca2+ fall velocity(s) | 0.187 ± 0.031 | 0.233 ± 0.034 | 0.162 ± 0.022# |
| Time at 50% from baseline to peak Ca2+(s) |
0.013 ± 0.002 | 0.018 ± 0.002** | 0.013 ± 0.001# |
| Time at peak Ca2+(s) | 0.053 ± 0.010 | 0.076 ± 0.018* | 0.048 ± 0.004# |
| Time at 50% from peak Ca2+ to full return(s) | 0.208 ± 0.025 | 0.286 ± 0.022*** | 0.206 ± 0.016## |
| Contractile recordings | |||
| Peak sarc displacement (μm) | 0.253 ± 0.053 | 0.154 ± 0.028** | 0.197 ± 0.042 |
| Time at max shortening velocity(s) | 0.031 ± 0.003 | 0.055 ± 0.007*** | 0.038 ± 0.004## |
| Time at max relengthening velocity(s) | 0.278 ± 0.029 | 0.536 ± 0.099*** | 0.324 ± 0.045## |
| Time at peak shortening(s) | 0.176 ± 0.012 | 0.320 ± 0.048*** | 0.201 ± 0.023## |
| Tau (exponential decay time constant) | 0.043 ± 0.009 | 0.085 ± 0.025** | 0.059 ± 0.017 |
Values are mean ± SD. Sarc, sarcomere, Fratio, fluorescence ratio. Statistical analysis by one-way ANOVA, post-hoc Tukey’s multiple group comparisons. Euthyroid and PTU (cardiomyocytes from 6 animals/group), PTU+T3 (7 animals/group);
p<0.05 vs EU,
p<0.01 vs EU,
p<0.0001 vs EU,
p<0.01 vs PTU,
p<0.0001 vs PTU.
The maximum sarcomere shortening (+Vmax sarc) and re-lengthening velocities (−Vmax sarc) were decreased significantly in cardiomyocytes isolated from PTU rats compared to EU animals (Fig. 2E,F). T3 treatment of the PTU rats significantly increased +Vmax and tended to increase −Vmax towards normal. Time at peak shortening, and time at max shortening and re-lengthening velocities were all significantly increased in the PTU cardiomyocytes, while T3 treatment completely normalized these effects (Table 2). The peak height of sarcomere displacement was significantly lower in the PTU compared to the EU myocytes, and T3 treatment increased sarcomere peak contraction towards normal values (Table 2). These recorded changes in contractile function due to thyroid status are in alignment with the changes observed in the Ca2+ transients.
3. 4. T-tubule periodicity
T-tubules (TT) in both isolated ventricular myocytes and LV tissue sections were visualized by WGA-488 staining and images were captured by confocal microscopy. Representative confocal images of myocytes and tissue sections from each of the study groups are shown in Fig. 3A, C. TTorg analysis of the captured images assessed the periodicity of the T-tubules, and this is represented by the TTpower metric. Significant disorganization of the TTs was observed in the isolated cardiomyocytes from PTU treated rats as indicated by ~15% reduction in TTpower compared to EU (control), whereas 2 weeks of T3 treatment of the PTU rats significantly improved TT periodicity to near normal values (Fig. 3B). TTorg analysis of ventricular tissue sections stained with WGA supported these positive effects of T3 on T-tubule organization (Fig. 3D). Fig. 3E shows representative ANEPPS stained cardiomyocytes from each study group. The transverse-oriented elements (TE) and longitudinal elements (LE) of the global T-tubule system were extracted from the skeletalized original images that preserved the morphologic patterns as described by Guo and Song37. The TE and LE density (%) are percent of total number of pixels of skeletalized TE or LE divided by the total number of pixels of the intracellular region of interest. This analysis showed that TE density was significantly decreased in the TH-deficient PTU myocytes, and although significantly increased by T3 treatment, the TE density remained lower than that in EU control cardiomyocytes (Fig. 3F). The LE density was increased in the PTU cells (p<0.001), but reduced significantly towards control values by T3 treatment. The TTint % is a measure of T-tubule integrity that takes into account both TE regularity and TE density. In this analysis, TTint was 50% lower in the PTU cells than in EU cells, but significantly increased towards normal by T3 treatment (Fig. 3F). Taken together, the WGA and ANEPPS confocal imaging analyses support a reduction in density and periodicity of the T-tubule system, supporting the recorded changes in Ca2+ transients and contractility in response to thyroid status.
Figure 3. Confocal microscopy of isolated cardiomyocytes and LV tissue showing T-tubule changes with thyroid status.

(A) Representative images of isolated cardiomyocytes from each study group (control or EU, PTU, PTU+T3) labeled with wheat germ agglutinin conjugated to AlexaFluor-488 (WGA-488) were captured using Nikon C2 LSC microscope with 63x oil immersion objective. Scale bar, 10 μm. (B) TTpower quantitative analysis of T-tubule organization in the WGA-stained myocytes with average TTpower value for each animal derived from ~15 z-stacks captured per cell of ~20 cells per heart; n= 4–6 rats/group. Bar graphs are mean ± SD. Statistical analysis used one-way ANOVA, post-hoc Tukey’s multiple comparisons test; p-values between groups are *p<0.01, **p<0.001. (C) Representative images of WGA-488 stained sections of LV tissue from rats of each study group. Confocal images captured as described above; scale bar, 10 μm. (D) Bar graph (mean ± SD) shows TTpower analysis of the T-tubules; n= 3–6 rats/group. One-way ANOVA, post-hoc Tukey’s multi-group comparisons, with †p<0.05, **p<0.001 between groups as indicated. (E) Representative images of di-8-ANEPPS stained cardiomyocytes from each treatment group. (F) AutoTT analysis of transverse- (TE) and longitudinal- (LE) oriented elements of T-tubule system, showing TE and LE density, and the index of TE-tubule integrity (TTint % = TE density x TE regularity). Data are mean ± SD, n=3–5 rats/group. One-way ANOVA, post-hoc Tukey’s multi-group comparisons showing p-values between groups; †p<0.05, *p<0.01, **p<0.001, ***p<0.0001.
3. 5. STORM imaging of RyR-Cav1.2 clusters
Representative STORM images of cardiomyocytes from each treatment group are shown in Fig. 4A,D,G. Prominent labeling of RyR (green) shows clusters in highly organized rows in EU and PTU+T3 conditions with significant disorganization in the PTU myocyte, similar to T-tubule organization observed with WGA or ANEPPS staining in Fig. 3. This re-distribution of RyR clusters in thyroid deficient hearts mirrors the disarray of T-tubules. Identification of clustering of RyRs was accomplished using a hierarchical density-based algorithm (HDBSCAN) with cluster size constraints (10×103 to 100×103 nm2) and this is illustrated in panels B, E and H. Shown in these panels are clusters of signal corresponding to RyR labeling as individual, arbitrarily color-coded spots or areas. A single cluster from each study group is shown enlarged in panels C, F and I (scale bar is 100 nm). Single cluster counts are the number of localizations associated with the corresponding RyR (green, channel 0) and Cav1.2 (magenta, channel 1) channels counted within a 210 nm radius around the centroid of the RyR cluster that was identified by the HDBSCAN algorithm. Individual localizations corresponding to RyR are shown overlaid as dots on the image reconstruction. The number of localizations in channel 0 (RyR) and channel 1 (Cav1.2) for each illustrated RyR cluster is indicated within panels C, F and I.
Figure 4. Super-resolution images of RyR clusters and Cav1.2 co-localizations.

Representative STORM images of ventricular myocytes isolated from Euthyroid (A-C), PTU (D-F) and PTU+T3 (G-I) treated animals. (A,D,G) RyR (green) shows highly organized rows of clusters with co-localization of L-type calcium channel (Cav1.2, magenta). Regions of interest (ROI, boxed area) equal to 170 μm2 were identified away from cell edges and nuclei. (B,E,H) Enlarged ROIs from panels A,D and G (scale bar, 5 μm). Hierarchical Density Based spatial clustering (HDBSCAN) was performed on each ROI and further refined by constraining cluster area between 10×103 and 100×103 nm2. Clusters of signal in the fluorescent channel corresponding to RyR labeling are shown as individual, arbitrarily color coded areas or spots. (C,F,I) Single clusters from panels B,E,H are enlarged (scale bar, 100 nm). Localizations associated with RyR (green, channel 0) and Cav1.2 (magenta, channel 1) were counted within 210 nm radius around the centroid of RyR clusters identified by the HDBSCAN, and shown overlaid as RyR dots on the image reconstructions. Localization number for channel 0 (RyR) and channel 1 (Cav1.2) are indicated in each panel. Not all localizations are included in clusters due to density around the perimeter and the area-constraints that were applied to the clusters. Reconstruction parameters, imaging conditions, and cluster-analysis constraints were the same for images of all sample groups. Comparison of cluster numbers and localizations among treatment groups are shown as bar graphs indicating group mean ± SD (n=3 hearts/group, ~10 cells imaged per heart, 1–3 ROI/cell). (J) Total number of RyR clusters per ROI (170 μm2) identified by HDBSCAN with cluster size constraints. (K) The number of RyR localizations in each cluster, and (L) the ratio of RyR to Cav1.2 localizations per cluster indicating significant differences among group means. Statistical analysis by one-way ANOVA, post-hoc Tukey’s multiple comparisons test; p-values between groups are indicated, *p< 0.05, **p< 0.01, †p= 0.05.
Quantitation of RyR cluster number in the ROIs for each study condition shows significant reduction in cluster numbers in the thyroid deficient (PTU) myocytes compared to EU and T3-treated PTU cells (Fig. 4J). The number of localizations counted within the RyR cluster attributable to RyR was significantly decreased by 58% in the PTU cells, whereas these localizations were increased to normal values by T3 treatment (mean ± SD =119 ± 17, 49 ± 16 and 106 ± 21; EU, PTU and PTU+T3, respectively) (Fig. 4K). Furthermore, the number of localizations attributable to Cav1.2 within each RyR cluster was not significantly reduced in PTU cells, and therefore, the ratio of RyR to Cav1.2 localizations per cluster was decreased in PTU myocytes due to reduced RyR number (Fig. 4L). Thus, in thyroid-deficient cells, each cluster centered on RyR contained fewer RyR localizations but relatively unchanged numbers of Cav1.2 localizations compared to that in either normal EU or T3-treated PTU cells.
3. 6. Expressed gene analysis by RT-PCR and RNAseq
Quantitative PCR of RNA extracted from ventricular tissue of the three study groups assessed differences in expression of several genes associated with EC-coupling and T-tubule structures that could potentially determine transcriptional modification by T3. Fig. 5A shows fold-changes in mRNA expression compared to EU controls. Analysis of known T3-responsive myosin heavy chain (MHC) genes showed the expected significant reduction in α-MHC mRNA (Myh6) and increase in β-MHC mRNA (Myh7) with thyroid deficiency (PTU), and subsequent normalization with T3 treatment42–44. Expression of known T3-responsive SR Ca2+-ATPase (SERCa2) was similarly decreased in PTU-treated hearts, and T3 treatment increased to EU values45. Among other calcium-regulatory/channel proteins, phospholamban (PLN) and ryanodine receptor (RyR2) mRNAs remained unchanged in response to changes in thyroid condition, while Cav1.2 (LTCC) mRNA increased (p<0.01) in the thyroid deficient PTU-treated hearts. Na-Ca2+ exchanger (NCX1) and caveolin-3 (Cav3) have been associated with LTCC-RyR2 couplons46. NCX1 mRNA was increased (p<0.01) in PTU hearts, while T3 treatment decreased its expression towards EU values. Of the two T-tubule associated structural proteins, Jph2 and BIN1, only Jph2 mRNA expression was decreased (p<0.05) in the PTU-treated hearts, and this was subsequently normalized to EU levels after T3 treatment. BIN1 mRNA was unaltered by any treatment condition.
Figure 5. Expressed gene analysis in myocardial tissue and cultured adult rat ventricular myocytes.

(A) Quantitative RT-PCR analysis of LV tissue from study groups (EU, PTU, PTU+T3) for expression of genes: myosin heavy chain (MHC)-α (Myh6) and MHC-β (Myh7), SR Ca2+-ATPase (SERCa2, Atp2a2), phospholamban (PLN), caveolin-3 (Cav3), Na+-Ca2+ exchanger (NCX1, Slc8a1), junctophilin-2 (Jph2), bridging integrator-1 (BIN1), ryanodine receptor-2 (RyR2), L-type calcium channel (LTCC, Cav1.2, Cacna1c). GAPDH or Rplp1 (ribosomal protein, large P1) was used for PCR cycle normalization. Data are presented as fold change compared to EU values for each gene. Bar graphs represent mean ± SD; n= 3–4 hearts/study group. Statistical analysis of each expressed gene used one-way ANOVA, post-hoc Tukey’s multiple comparisons test; ‡p< 0.05 vs EU and PTU+T3; *p< 0.01 vs EU and PTU+T3; ***p< 0.0001 vs EU and PTU+T3; †p< 0.05 vs PTU; ††p< 0.05 vs EU.
(B) RNAseq analysis of LV tissue RNA from PTU and PTU+T3 treated rats (n=3/group). Data are fold-change compared to PTU for the selected genes; bar graphs show mean ± SD. Expressed genes as in (A). Statistical analysis used the Wald Chi-Squared test to compare PTU vs PTU+T3; *p< 0.01, **p<0.001, ***p< 0.0001.
(C) Adult rat ventricular myocytes (ARVM) were cultured without (0) or with (+) T3 (10−7 M) over a 72h period. Cultures were harvested at 2h, 24h, 48h and 72h for gene expression analysis using RT-PCR. Data are presented as fold change compared to no T3 treatment (0 T3) at each time point. The 2h time point data were obtained from adhered cardiomyocytes cultured for 2h in 10% FBS, and data are expressed as fold change compared to 24h +T3 treated cardiomyocytes. Bar graphs represent mean ± SD; n= 3 separate cell isolations, 2 culture dishes/treatment at each time point. Student’s t-test used for statistical comparison between 0 T3 vs +T3 treatments at each time point, *p< 0.01, ‡p< 0.05; †p<0.05 vs 24h +T3.
Using an unbiased approach to gene expression by sequencing RNA (RNAseq) purified from hearts of PTU and PTU+T3 treated animals identified 567 differentially expressed genes by >2-fold. The complete differential gene expression analysis data file can be accessed in the Supplemental section. The select group of genes under study herein are presented in Fig. 5B showing fold changes in gene expression in T3-treated hearts (PTU+T3) relative to PTU. The effect of T3 on thyroid deficient hearts showed near complete myosin heavy chain (MHC) isoform gene switching from β-MHC (Myh7) to α-MHC (Myh6). Supporting the RT-PCR data in Fig. 5A, RNAseq analysis showed that expression of SERCa2 was increased ~2-fold by T3 treatment, while PLN, Cav3 and RyR2 were not altered. Expression of LTCC and NCX1 were decreased by T3 treatment similar to that measured by RT-PCR. The T3-responsiveness of Jph2 expression was confirmed by RNAseq analysis, while expression of BIN1 was significantly decreased by T3 treatment which was in contrast to that observed by RT-PCR and remains unexplained at present.
3. 7. Cultured adult ventricular myocytes
Isolated adult rat ventricular myocytes (ARVM) were cultured to further examine direct effects of T3 on expression of key proteins integral to T-tubule structures, independent of hemodynamic load and other systemic in vivo effects. Fig. 5C shows the RT-PCR quantitation of Jph2, BIN1 and SERCa2 mRNAs in myocyte cultures treated with T3 and expressed as fold change relative to untreated cultures at each time point. Results support T3-induced expression of Jph2 at each time point with statistically significant (p<0.01) increases after 48h and 72h of culture. In contrast, T3 had no effect on the expression of BIN1 mRNA. The well-studied T3-responsive gene, SERCa2, showed increasing mRNA content over the 72h period of incubation with T3, with significance reached by 72h (p<0.05). It is recognized that isolated adult cardiac myocytes lose significant cellular proteins and architecture when cultured over a period of days. Therefore, shown for comparison, is the expression of these genes in freshly isolated cardiomyocytes adhered to laminin-coated culture dishes after 2h of plating. Jph2 and SERCA2 expression at the 2h time point compared to 24h in culture was higher by approximately 2-fold indicating loss of these mRNAs by 24h of culture, but with subsequent regain in expression by 72hrs in the presence of T3. In contrast, BIN1 mRNA in freshly plated myocytes remained unchanged after culturing for 24h to 72h with or without T3.
4. Discussion
4. 1. Validity of the animal model and treatment protocol
In order to establish direct T3 responses without confounding effects inherent in cardiac disease models, we used an animal model of thyroid hormone deficiency to study the effects specific to T3 on T-tubule organization and dyadic RyR-Cav1.2 clusters, and on Ca2+ transients and contractility. The primary study findings described herein support a unique requirement of T3 activity on these processes. We used PTU to decrease both T4 and T3 since this drug inhibits thyroperoxidase in the thyroid gland as well as 5’-deiodinase activity in peripheral tissue, thus preventing conversion of T4 to T3 and resulting in reduced T4 and T3 in blood and tissues. Ten weeks of PTU treatment caused significant reductions of serum T3 and T4. Continued PTU ingestion while receiving a replacement dose of T3 for 2 weeks normalized serum T3 but kept serum T4 levels low. Therefore, this model focused on the specific role of T3 on cardiac outcomes. The T3 dose used (10 ug/kg/d; delivered orally) was based on our prior studies showing restoration of cardiac tissue T3 content.34 The reduced heart rate and changes in echocardiographic measurements in the PTU treated rats were indicative of a hypothyroid state, while the T3 treatment completely restored functional parameters to normal without inducing hyperthyroidism (Table 1). Thus, this animal model and experimental conditions were appropriate for our study objectives.
4. 2. LV function measured in vivo and in isolated cardiomyocytes
LV pressure recordings obtained in vivo under light anesthesia indicated that maximum LV pressure and rates of pressure development were significantly impaired in PTU rats, and that T3 treatment produced significant improvements in these functional parameters, albeit not restored completely to normal (Fig. 1). These observations were supported by measurements recorded in isolated ventricular myocytes using video-based edge detection coupled to fluorescence microscopy to simultaneously record contractile cycles and Ca2+ transients in response to field stimulation. In the TH deficient PTU cells, the maximum velocities of the rise and fall of the Ca2+ transients were decreased, and the time taken to reach peak Ca2+ was prolonged. T3 treatment completely restored the Ca2+ curve displacements to normal (Fig. 2, Table 2). These data suggest that T3 treatment of thyroid deficient hearts improved EC-coupling with faster Ca2+-induced calcium release (CICR) as would occur with optimized RyR2-LTCC couplon function. Secondly, increased velocity of the Ca2+ transient fall indicates increased re-uptake by SR Ca2+-ATPase (SERCa2), which is a known T3 activated gene.47 A role for Na+-Ca2+ exchanger (NCX) in regulating Ca2+ transients in response to thyroid hormones has been implied during cardiac development when circulating T3/T4 concentrations undergo rapid changes.48, 49 This is consistent with higher NCX mRNA in PTU hearts found in the current study. Electrophysiologic recordings of single cells could best address the relative roles of NCX and SERCa2 in Ca2+ extrusion under different thyroid conditions, including low T3 or subclinical hypothyroidism often observed in HF (reviewed by Eisner et al50). Furthermore, nano-imaging approaches would advance our understanding of the specific changes in NCX localization on sarcolemma and T-tubules in response to thyroid hormones (reviewed in Scriven & Moore51). We showed herein that the Ca2+ peak (Fura2 and Fluo4 experiments) was lower in PTU myocytes than in either EU or PTU+T3 cells, supporting less intracellular Ca2+ during systole, potentially the result of reduced SR Ca2+content. These results are supported by studies in which caffeine stimulation of isolated cardiomyocytes showed that SR Ca2+ content was decreased in hypothyroid myocytes due to reduced SERCA2 activity.52 The cardiomyocyte contraction and relaxation velocities were in alignment with changes in the Ca2+ displacements, with slower rates in TH-deficient cells and a return towards normal with T3 treatment. These data in cells recapitulated results from LV pressure measurements in vivo during systole and diastole (±dP/dt in Fig. 1).
4. 3. T-tubule organization and RyR-Cav1.2 clusters
We used WGA-staining of isolated ventricular myocytes and LV tissue sections to visualize T-tubule organization, and the TTorg analysis program for quantitation (Fig. 3). The marked reduction in TT periodicity in both tissue and cells from thyroid hormone deficient hearts, and its normalization after T3 treatment have not been previously reported. Dulhunty et al53 in 1986 used electron microscopy to show that a high dose of T3 treatment (150 ug/kg/d for ~20d) increased by two-fold the amount of T-tubule membrane per 100 μm3 of fiber volume in skeletal muscles (soleus and EDL) in rats. The amount of terminal cisternae was minimally changed, resulting in a disproportionate increase in T-tubule membranes and increased dyadic junctions between the membranes of TTs and terminal cisternae. Using voltage clamp technique, the authors concluded that the increased membrane capacity and conductance was a result of the increased TT membrane area, and the increased isometric contraction speed after T3 treatment resulted from altered EC-coupling and Ca2+ release rather than changes in contractile proteins. Our analysis using ANEPPS staining showed that transverse-oriented tubule density was significantly diminished with TH deficiency, whereas the longitudinal-oriented tubules were increased. In our prior studies of heart failure in rats in which serum levels of T3 were low, we had also observed reduced T-tubule periodicity and similar changes in transverse vs longitudinal tubule densities as observed in the present study. Treatment with T3 similarly normalized these structural elements with subsequent improvements in Ca2+ mobilization and myocyte contractility.20 Several studies have reported a requirement of THs in promoting T-tubule structural and functional maturation. Jackman et al19 showed that sustained electrically induced-contractile activity and T3 treatment synergistically promoted ultrastructural and functional maturation of neonatal rat ventricular myocytes to that characteristic of adult myocytes. In other studies using cardiomyocytes derived from human induced pluripotent stem cells (hiPSC-CM) or murine embryonic stem cells similarly were shown to require T3 for differentiation and maturation of T-tubules, enhanced CICR and EC coupling.54, 55 Furthermore, Parikh et al18 found that T3 combined with glucocorticoid treatment of hiPSC-CM promoted T-tubule density and RyR2 organization, and that measurements of Ca2+ current confirmed an enhanced functional coupling between LTCC and RyR2.
To further support our hypothesis that T3 has a regulatory role in dyadic structures juxtaposing T-tubules with junctional SR to promote RyR2-Cav1.2 coupling, we used STORM imaging to localize RyR2-Cav1.2 clusters (Fig. 4). Compared to euthyroid cardiomyocytes, thyroid-deficient myocytes had: 1) reduced numbers of RyR2 clusters arranged in misaligned rows similar to T-tubule disorganization observed with ANEPPS staining, 2) decreased RyR2 localizations per cluster, and 3) significantly decreased ratio of RyR to Cav1.2 localizations within RyR clusters. T3 treatment alone reversed the disarray of RyR2-Cav1.2 clusters in both organization, size and numbers to that resembling EU controls. Our STORM imaging of RyR2 clusters in normal (EU) adult cardiomyocytes are largely supported by those previously published by many others,39, 41, 56–58 and to our knowledge the present data represent the first report of reduced number and size of RyR clusters in response to thyroid deficiency. In contrast, Cav1.2 (LTCC) localizations associated with RyR clusters was unchanged in PTU myocytes; however, it is unclear whether this decrease in RyR:Cav1.2 ratio would result in altered CICR and thus, EC coupling. Our HDBSCAN analysis of RyR clusters in which area was constrained between 10×103 to 100×103 nm2 yielded clusters containing varying RyR numbers (localizations); however, the arrangement of RyRs within clusters cannot be determined by STORM imaging. The intra-cluster arrangement of RyRs in either checkerboard, side-by-side or disordered patterns has been observed by others, and likely influences coupled gating of channels.39, 59 Organization of RyR clusters within the SR is also a critical determinant of EC coupling, and RyR clusters have been shown to be dispersed in post-infarction failing hearts, leading to slowing of Ca2+ spark kinetics.57, 59
Jones et al31 recently reviewed the role of plasticity of the dyadic structures that contain RyR2 and LTCC channels in regulating EC coupling in cardiac disease. Junctional SR (jSR) forms dyads with surface sarcolemma and with both transverse and longitudinally-oriented tubules, and the dyadic protein junctophilin2 (Jph2) with its MORN motifs anchors the T-tubule membrane to the jSR.60 Loss of Jph2 in HF models has been shown to result in loss of dyadic structures containing LTCCs, and reduction in expression of the T-tubule folding protein BIN1 furthers the loss of these dyadic LTCCs.29, 61 BIN1 has been shown to have a role in trafficking LTCCs along microtubules and delivering them to the T-tubules where these LTCCs remain in position by the BIN1-induced microfolds within the T-tubule membrane.26, 62 Our data support the plasticity of the SR and T-tubule structures and the fluid nature of clustering of RyR2 and Cav1.2 in response to T3 depletion and subsequently to T3 replacement within a relatively short time period. In this context, we examined expression of T3-regulated genes to identify mechanisms by which T3 could affect TT membrane structure/organization. Furthermore, thyroid hormones are known to act rapidly by non-genomic mechanisms.16, 63 For example, post-translational modifications of RyRs have been shown to alter its clustering configurations, and thereby its function,39 and whether T3 acts by these potential mechanisms will require further study.
Measurements of Ca2+ transients reported herein suggest that systolic intracellular Ca2+ was reduced in PTU cells, and that both rates of Ca2+ release and re-uptake into the SR were impaired, although we did not detect any delay in initiation of SR Ca2+ release. However, simultaneous contractile recordings with Ca2+ transients showed significant delay in sarcomere shortening (i.e., contraction) and subsequently, sarcomere relaxation. We conclude that the changes observed in RyR-Cav1.2 clusters, possibly as a result of T-tubule disarray in thyroid deficient myocytes, resulted in significant impairment of CICR and EC-coupling, and subsequently, reduced contractile dynamics.
4. 4. T3 regulates TT and SR structural and functional genes
Structural similarities between the developing and diseased myocardium suggest that re-expression of “fetal” genes, many of which are T3-regulated, are responsible for the pathological remodeling of the T-tubule/SR structures and component proteins. We sought to determine whether expression of critical TT/SR proteins were directly regulated by T3 and thus provide a mechanism by which T-tubule structure, function and EC coupling are altered in TH-deficient conditions that includes heart failure. T3-responsive Myh6, Myh7 and SERCa2 genes44, 45 were altered as expected in TH-deficient PTU hearts and the T3 dose34 was sufficient to reverse these changes (Fig. 5A). Increased expression of NCX1 has been reported during the fetal period concomitant with low circulating TH levels, with subsequent down-regulation in the early postnatal period when TH concentrations surge. It is thought that the role of NCX in removing Ca2+ from the sarcoplasm during diastole in the post-natal heart diminishes while SERCA2 function in Ca2+ re-uptake into the SR increases.64–66 Similarly, in the adult heart NCX1 expression is antithetically regulated to that of SERCA2 in response to TH conditions. Whether elevated NCX activity contributes to EC coupling during TH-deficiency is not clear, although some evidence suggests that a small proportion of NCXs co-localize with RyR clusters, potentially contributing to Ca2+ influx during ECC or alternatively, to lower Ca2+ from the intra-couplon space during diastole.67–69
Recent studies have implicated a mechanistic role for microRNAs in suppressing transcriptional activity in response to T3.63, 70, 71 Jph2 expression was markedly reduced in PTU myocytes and normalized by T3 which could partially explain the observed changes in T-tubule/jSR organization and distribution of dyadic RyR2-LTCC clusters.72 Jph2 mRNA has been identified as a target of miR-24 and miR-34a that are increased in murine models of hypertrophy and HF, as well as in human failing myocardium.73, 74 T3 regulation of miRNAs has been reported, but not yet identified in the regulation of Jph2 expression.70, 71 To ascertain direct effects of T3 on Jph2 expression, adult cardiomyocytes were cultured in the presence and absence of T3 (Fig. 5C). Jph2 mRNA was increased progressively between 24 and 72 hrs of culture with T3, thus suggesting a regulatory role of T3 on Jph2, leading to preservation of the TT/jSR/dyadic structures that is further supported by the imaging data reported herein. Several recent studies have expanded the role of Jph2 as a key player in dyad assembly by interacting directly with LTCCs75, and additionally, acting in a transcriptional capacity under conditions of stress and disease.76 Cheah et al77 characterized the T-tubule subproteome using immunohistochemical images from the Human Protein Atlas cardiac tissue microarrays, and identified 78 novel putative T-tubule proteins and generated a single interactome map. These revelations and the potential role of thyroid hormones in maintaining dyadic couplings in cardiomyocytes will advance therapeutic approaches in the treatment of heart disease.
4. 5. Limitations
Our use of super-resolution microscopy provided clear evidence of changes in clustering patterns of RyR2 and Cav 1.2 in response to thyroid status. However, single-molecule localization imaging in three-dimensions58, 78 and using DNA-PAINT imaging approaches41 would allow for additional insights into RyR-Cav1.2 clusters and intra-cluster RyR arrangements in response to T3. These methods would require alternative methods and STORM image data in a different format than was available for this study.
4. 6. Study conclusions
The primary conclusion of this study is the recognition of a direct regulatory role of T3 in T-tubule organization, in part by up-regulating Jph2 expression, and as a consequence, the importance of T3 in maintaining RyR2-LTCC clusters in dyadic structures necessary for effective EC coupling. Therefore, the low T3 syndrome and subclinical hypothyroidism often associated with cardiac disease requires treatment with the goal to normalize TH function. An on-going NIH supported clinical trial (NCT04111536) is a randomized, double-blind, placebo-controlled, cross-over study aimed to develop oral L-T3 therapy for patients with HF with preserved ejection fraction and low T3 syndrome. It has the potential to alter the course of patient care in this disease setting.
Supplementary Material
Highlights:
Thyroid hormone deficient hearts have disorganized T-tubules, impaired EC coupling
Thyroid deficiency causes decreased rates of Ca2+ release/re-uptake, reduced contractility
STORM imaging shows reduced RyR2 cluster number and size in T3-deficient myocytes
T3 induces Jph2 expression, improves T-tubule organization, increases RyR clusters
Acknowledgements:
This research was supported by funding from the National Institutes of Health, United States Department of Health and Human Services (R15HL154068 to KO). We thank the team at Oxford Nanoimaging Inc., Oxford, UK for developing the clustering algorithm program, and working with us on our analysis of the STORM images presented herein. We thank Yuan Huang, MD for her technical expertise in adult CM isolation and culture, and assistance in IonOptix recordings.
Abbreviations
- BIN1
Bridging integrator-1 or amphiphysin 2
- Jph2
Junctophilin 2
- BDM
2,3-butanedione monoxime
- DAPI
4’,6-diamidino-2-phenylindole
- ECC
Excitation contraction coupling, EC coupling
- CVD
Cardiovascular diseases
- HF
Heart failure
- LV
Left ventricle
- Cav1.2
Calcium channel voltage-dependent L-type alpha 1C subunit
- LTCC
L-type calcium channels
- RyR2
Ryanodine receptor 2
- SR
Sarco-(endo)plasmic reticulum
- SERCA
Sarcoplasmic reticulum calcium-ATPase
- LT3S
Low T3-syndrome
- T3
Triiodo-L-thyronine
- T4
Thyroxine
- TT or T-tubules
Transverse-tubules
- WGA
Wheat germ agglutinin
Footnotes
Disclosures:
None.
Availability of data and materials: The datasets used and/or analyzed during the current study are available from the corresponding author upon reasonable request.
Ethics approval and consent to participate: Animals were treated in accordance with the National Institutes of Health Guidelines for the Use and Care of Laboratory Animals (HHS Pub. No.85–23). Study protocols were approved by the Institutional Animal Care and Use Committee of the New York Institute of Technology College of Osteopathic Medicine.
Publisher's Disclaimer: This is a PDF file of an unedited manuscript that has been accepted for publication. As a service to our customers we are providing this early version of the manuscript. The manuscript will undergo copyediting, typesetting, and review of the resulting proof before it is published in its final form. Please note that during the production process errors may be discovered which could affect the content, and all legal disclaimers that apply to the journal pertain.
References
- 1.Galli E, Pingitore A and Iervasi G. The role of thyroid hormone in the pathophysiology of heart failure: clinical evidence. Heart Fail Rev. 2010;15:155–69. [DOI] [PubMed] [Google Scholar]
- 2.Kannan L, Shaw PA, Morley MP, Brandimarto J, Fang JC, Sweitzer NK, Cappola TP and Cappola AR. Thyroid Dysfunction in Heart Failure and Cardiovascular Outcomes. Circulation Heart failure. 2018;11:e005266. [DOI] [PMC free article] [PubMed] [Google Scholar]
- 3.Tseng FY, Lin WY, Lin CC, Lee LT, Li TC, Sung PK and Huang KC. Subclinical hypothyroidism is associated with increased risk for all-cause and cardiovascular mortality in adults. J Am Coll Cardiol. 2012;60:730–7. [DOI] [PubMed] [Google Scholar]
- 4.Iervasi G, Pingitore A, Landi P, Raciti M, Ripoli A, Scarlattini M, L’Abbate A and Donato L. Low-T3 syndrome: a strong prognostic predictor of death in patients with heart disease. Circulation. 2003;107:708–13. [DOI] [PubMed] [Google Scholar]
- 5.Rodondi N, den Elzen WP, Bauer DC, Cappola AR, Razvi S, Walsh JP, Asvold BO, Iervasi G, Imaizumi M, Collet TH, Bremner A, Maisonneuve P, Sgarbi JA, Khaw KT, Vanderpump MP, Newman AB, Cornuz J, Franklyn JA, Westendorp RG, Vittinghoff E and Gussekloo J. Subclinical hypothyroidism and the risk of coronary heart disease and mortality. JAMA. 2010;304:1365–74. [DOI] [PMC free article] [PubMed] [Google Scholar]
- 6.Mitchell JE, Hellkamp AS, Mark DB, Anderson J, Johnson GW, Poole JE, Lee KL and Bardy GH. Thyroid function in heart failure and impact on mortality. JACC Heart failure. 2013;1:48–55. [DOI] [PMC free article] [PubMed] [Google Scholar]
- 7.Sato Y, Yoshihisa A, Kimishima Y, Kiko T, Kanno Y, Yokokawa T, Abe S, Misaka T, Sato T, Oikawa M, Kobayashi A, Yamaki T, Kunii H, Nakazato K and Takeishi Y. Low T3 Syndrome Is Associated With High Mortality in Hospitalized Patients With Heart Failure. J Card Fail. 2019;25:195–203. [DOI] [PubMed] [Google Scholar]
- 8.Moon S, Kim MJ, Yu JM, Yoo HJ and Park YJ. Subclinical Hypothyroidism and the Risk of Cardiovascular Disease and All-Cause Mortality: A Meta-Analysis of Prospective Cohort Studies. Thyroid. 2018;28:1101–1110. [DOI] [PubMed] [Google Scholar]
- 9.Hayashi T, Hasegawa T, Kanzaki H, Funada A, Amaki M, Takahama H, Ohara T, Sugano Y, Yasuda S, Ogawa H and Anzai T. Subclinical hypothyroidism is an independent predictor of adverse cardiovascular outcomes in patients with acute decompensated heart failure. ESC Heart Fail. 2016;3:168–176. [DOI] [PMC free article] [PubMed] [Google Scholar]
- 10.Yancy CW, Jessup M, Bozkurt B, Butler J, Casey DE Jr., Drazner MH, Fonarow GC, Geraci SA, Horwich T, Januzzi JL, Johnson MR, Kasper EK, Levy WC, Masoudi FA, McBride PE, McMurray JJ, Mitchell JE, Peterson PN, Riegel B, Sam F, Stevenson LW, Tang WH, Tsai EJ, Wilkoff BL, American College of Cardiology F and American Heart Association Task Force on Practice G. 2013 ACCF/AHA guideline for the management of heart failure: a report of the American College of Cardiology Foundation/American Heart Association Task Force on Practice Guidelines. J Am Coll Cardiol. 2013;62:e147–239. [DOI] [PubMed] [Google Scholar]
- 11.Hamilton MA, Stevenson LW, Fonarow GC, Steimle A, Goldhaber JI, Child JS, Chopra IJ, Moriguchi JD and Hage A. Safety and hemodynamic effects of intravenous triiodothyronine in advanced congestive heart failure. The American journal of cardiology. 1998;81:443–7. [DOI] [PubMed] [Google Scholar]
- 12.Moruzzi P, Doria E and Agostoni PG. Medium-term effectiveness of L-thyroxine treatment in idiopathic dilated cardiomyopathy. Am J Med. 1996;101:461–7. [DOI] [PubMed] [Google Scholar]
- 13.Pingitore A, Galli E, Barison A, Iervasi A, Scarlattini M, Nucci D, L’Abbate A, Mariotti R and Iervasi G. Acute effects of triiodothyronine (T3) replacement therapy in patients with chronic heart failure and low-T3 syndrome: a randomized, placebo-controlled study. J Clin Endocrinol Metab. 2008;93:1351–8. [DOI] [PubMed] [Google Scholar]
- 14.Wandell P, Carlsson AC, Holzmann MJ, Arnlov J, Sundquist J and Sundquist K. Comparison of Mortality and Nonfatal Cardiovascular Events in Adults With Atrial Fibrillation With Versus Without Levothyroxine Treatment. The American journal of cardiology. 2017;120:1974–1979. [DOI] [PMC free article] [PubMed] [Google Scholar]
- 15.Pingitore A, Mastorci F, Piaggi P, Aquaro GD, Molinaro S, Ravani M, De Caterina A, Trianni G, Ndreu R, Berti S, Vassalle C and Iervasi G. Usefulness of Triiodothyronine Replacement Therapy in Patients With ST Elevation Myocardial Infarction and Borderline/Reduced Triiodothyronine Levels (from the THIRST Study). The American journal of cardiology. 2019;123:905–912. [DOI] [PubMed] [Google Scholar]
- 16.Gerdes AM and Ojamaa K. Thyroid Hormone and Cardioprotection. Comprehensive Physiology. 2016;6:1199–219. [DOI] [PubMed] [Google Scholar]
- 17.Jabbar A, Pingitore A, Pearce SH, Zaman A, Iervasi G and Razvi S. Thyroid hormones and cardiovascular disease. Nat Rev Cardiol. 2017;14:39–55. [DOI] [PubMed] [Google Scholar]
- 18.Parikh SS, Blackwell DJ, Gomez-Hurtado N, Frisk M, Wang L, Kim K, Dahl CP, Fiane A, Tonnessen T, Kryshtal DO, Louch WE and Knollmann BC. Thyroid and Glucocorticoid Hormones Promote Functional T-Tubule Development in Human-Induced Pluripotent Stem Cell-Derived Cardiomyocytes. Circulation research. 2017;121:1323–1330. [DOI] [PMC free article] [PubMed] [Google Scholar]
- 19.Jackman C, Li H and Bursac N. Long-term contractile activity and thyroid hormone supplementation produce engineered rat myocardium with adult-like structure and function. Acta Biomater. 2018;78:98–110. [DOI] [PMC free article] [PubMed] [Google Scholar]
- 20.An S, Gilani N, Huang Y, Muncan A, Zhang Y, Tang YD, Gerdes AM and Ojamaa K. Adverse transverse-tubule remodeling in a rat model of heart failure is attenuated with low-dose triiodothyronine treatment. Mol Med. 2019;25:53. [DOI] [PMC free article] [PubMed] [Google Scholar]
- 21.Scriven DR, Asghari P and Moore ED. Microarchitecture of the dyad. Cardiovasc Res. 2013;98:169–76. [DOI] [PubMed] [Google Scholar]
- 22.Pinali C, Malik N, Davenport JB, Allan LJ, Murfitt L, Iqbal MM, Boyett MR, Wright EJ, Walker R, Zhang Y, Dobryznski H, Holt CM and Kitmitto A. Post-Myocardial Infarction T-tubules Form Enlarged Branched Structures With Dysregulation of Junctophilin-2 and Bridging Integrator 1 (BIN-1). J Am Heart Assoc. 2017;6. [DOI] [PMC free article] [PubMed] [Google Scholar]
- 23.Reynolds JO, Quick AP, Wang Q, Beavers DL, Philippen LE, Showell J, Barreto-Torres G, Thuerauf DJ, Doroudgar S, Glembotski CC and Wehrens XH. Junctophilin-2 gene therapy rescues heart failure by normalizing RyR2-mediated Ca(2+) release. International journal of cardiology. 2016;225:371–380. [DOI] [PMC free article] [PubMed] [Google Scholar]
- 24.Caldwell JL, Smith CE, Taylor RF, Kitmitto A, Eisner DA, Dibb KM and Trafford AW. Dependence of cardiac transverse tubules on the BAR domain protein amphiphysin II (BIN-1). Circulation research. 2014;115:986–96. [DOI] [PMC free article] [PubMed] [Google Scholar]
- 25.Manfra O, Frisk M and Louch WE. Regulation of Cardiomyocyte T-Tubular Structure: Opportunities for Therapy. Current heart failure reports. 2017;14:167–178. [DOI] [PMC free article] [PubMed] [Google Scholar]
- 26.Hong T, Yang H, Zhang SS, Cho HC, Kalashnikova M, Sun B, Zhang H, Bhargava A, Grabe M, Olgin J, Gorelik J, Marban E, Jan LY and Shaw RM. Cardiac BIN1 folds T-tubule membrane, controlling ion flux and limiting arrhythmia. Nat Med. 2014;20:624–32. [DOI] [PMC free article] [PubMed] [Google Scholar]
- 27.Chen B, Li Y, Jiang S, Xie YP, Guo A, Kutschke W, Zimmerman K, Weiss RM, Miller FJ, Anderson ME and Song LS. beta-Adrenergic receptor antagonists ameliorate myocyte T-tubule remodeling following myocardial infarction. FASEB J. 2012;26:2531–7. [DOI] [PMC free article] [PubMed] [Google Scholar]
- 28.Schobesberger S, Wright P, Tokar S, Bhargava A, Mansfield C, Glukhov AV, Poulet C, Buzuk A, Monszpart A, Sikkel M, Harding SE, Nikolaev VO, Lyon AR and Gorelik J. T-tubule remodelling disturbs localized beta2-adrenergic signalling in rat ventricular myocytes during the progression of heart failure. Cardiovasc Res. 2017;113:770–782. [DOI] [PMC free article] [PubMed] [Google Scholar]
- 29.Hong TT, Smyth JW, Chu KY, Vogan JM, Fong TS, Jensen BC, Fang K, Halushka MK, Russell SD, Colecraft H, Hoopes CW, Ocorr K, Chi NC and Shaw RM. BIN1 is reduced and Cav1.2 trafficking is impaired in human failing cardiomyocytes. Heart Rhythm. 2012;9:812–20. [DOI] [PMC free article] [PubMed] [Google Scholar]
- 30.Seidel T, Navankasattusas S, Ahmad A, Diakos NA, Xu WD, Tristani-Firouzi M, Bonios MJ, Taleb I, Li DY, Selzman CH, Drakos SG and Sachse FB. Sheet-Like Remodeling of the Transverse Tubular System in Human Heart Failure Impairs Excitation-Contraction Coupling and Functional Recovery by Mechanical Unloading. Circulation. 2017;135:1632–1645. [DOI] [PMC free article] [PubMed] [Google Scholar]
- 31.Jones PP, MacQuaide N and Louch WE. Dyadic Plasticity in Cardiomyocytes. Front Physiol. 2018;9:1773. [DOI] [PMC free article] [PubMed] [Google Scholar]
- 32.Guo A, Zhang C, Wei S, Chen B and Song LS. Emerging mechanisms of T-tubule remodelling in heart failure. Cardiovasc Res. 2013;98:204–15. [DOI] [PMC free article] [PubMed] [Google Scholar]
- 33.Wei S, Guo A, Chen B, Kutschke W, Xie YP, Zimmerman K, Weiss RM, Anderson ME, Cheng H and Song LS. T-tubule remodeling during transition from hypertrophy to heart failure. Circulation research. 2010;107:520–31. [DOI] [PMC free article] [PubMed] [Google Scholar]
- 34.Weltman NY, Ojamaa K, Savinova OV, Chen YF, Schlenker EH, Zucchi R, Saba A, Colligiani D, Pol CJ and Gerdes AM. Restoration of cardiac tissue thyroid hormone status in experimental hypothyroidism: a dose-response study in female rats. Endocrinology. 2013;154:2542–52. [DOI] [PMC free article] [PubMed] [Google Scholar]
- 35.Pasqualin C, Gannier F, Malecot CO, Bredeloux P and Maupoil V. Automatic quantitative analysis of t-tubule organization in cardiac myocytes using ImageJ. Am J Physiol Cell Physiol. 2015;308:C237–45. [DOI] [PubMed] [Google Scholar]
- 36.Schindelin J, Arganda-Carreras I, Frise E, Kaynig V, Longair M, Pietzsch T, Preibisch S, Rueden C, Saalfeld S, Schmid B, Tinevez JY, White DJ, Hartenstein V, Eliceiri K, Tomancak P and Cardona A. Fiji: an open-source platform for biological-image analysis. Nat Methods. 2012;9:676–82. [DOI] [PMC free article] [PubMed] [Google Scholar]
- 37.Guo A and Song LS. AutoTT: automated detection and analysis of T-tubule architecture in cardiomyocytes. Biophys J. 2014;106:2729–36. [DOI] [PMC free article] [PubMed] [Google Scholar]
- 38.Pei J Advances in knowledge discovery and data mining : 17th Pacific-Asia Conference, PAKDD 2013, Gold Coast, Australia, April 14–17, 2013 : proceedings. Berlin; New York: Springer; 2013. [Google Scholar]
- 39.Asghari P, Scriven DR, Ng M, Panwar P, Chou KC, van Petegem F and Moore ED. Cardiac ryanodine receptor distribution is dynamic and changed by auxiliary proteins and post-translational modification. Elife. 2020;9. [DOI] [PMC free article] [PubMed] [Google Scholar]
- 40.Baddeley D, Jayasinghe ID, Lam L, Rossberger S, Cannell MB and Soeller C. Optical single-channel resolution imaging of the ryanodine receptor distribution in rat cardiac myocytes. Proceedings of the National Academy of Sciences of the United States of America. 2009;106:22275–80. [DOI] [PMC free article] [PubMed] [Google Scholar]
- 41.Jayasinghe I, Clowsley AH, Lin R, Lutz T, Harrison C, Green E, Baddeley D, Di Michele L and Soeller C. True Molecular Scale Visualization of Variable Clustering Properties of Ryanodine Receptors. Cell Rep. 2018;22:557–567. [DOI] [PMC free article] [PubMed] [Google Scholar]
- 42.Balkman C, Ojamaa K and Klein I. Time course of the in vivo effects of thyroid hormone on cardiac gene expression. Endocrinology. 1992;130:2001–6. [DOI] [PubMed] [Google Scholar]
- 43.Flink IL and Morkin E. Interaction of thyroid hormone receptors with strong and weak cis-acting elements in the human alpha-myosin heavy chain gene promoter. J Biol Chem. 1990;265:11233–7. [PubMed] [Google Scholar]
- 44.van Rooij E, Sutherland LB, Qi X, Richardson JA, Hill J and Olson EN. Control of stress-dependent cardiac growth and gene expression by a microRNA. Science. 2007;316:575–9. [DOI] [PubMed] [Google Scholar]
- 45.Hartong R, Wang N, Kurokawa R, Lazar MA, Glass CK, Apriletti JW and Dillmann WH. Delineation of three different thyroid hormone-response elements in promoter of rat sarcoplasmic reticulum Ca2+ATPase gene. Demonstration that retinoid X receptor binds 5’ to thyroid hormone receptor in response element 1. J Biol Chem. 1994;269:13021–9. [PubMed] [Google Scholar]
- 46.Asghari P, Scriven DR, Hoskins J, Fameli N, van Breemen C and Moore ED. The structure and functioning of the couplon in the mammalian cardiomyocyte. Protoplasma. 2012;249 Suppl 1:S31–8. [DOI] [PubMed] [Google Scholar]
- 47.Moriscot AS, Sayen MR, Hartong R, Wu P and Dillmann WH. Transcription of the rat sarcoplasmic reticulum Ca2+ adenosine triphosphatase gene is increased by 3,5,3’-triiodothyronine receptor isoform-specific interactions with the myocyte-specific enhancer factor-2a. Endocrinology. 1997;138:26–32. [DOI] [PubMed] [Google Scholar]
- 48.Artman M, Ichikawa H, Avkiran M and Coetzee WA. Na+/Ca2+ exchange current density in cardiac myocytes from rabbits and guinea pigs during postnatal development. Am J Physiol. 1995;268:H1714–22. [DOI] [PubMed] [Google Scholar]
- 49.Studer R, Reinecke H, Vetter R, Holtz J and Drexler H. Expression and function of the cardiac Na+/Ca2+ exchanger in postnatal development of the rat, in experimental-induced cardiac hypertrophy and in the failing human heart. Basic research in cardiology. 1997;92 Suppl 1:53–8. [DOI] [PubMed] [Google Scholar]
- 50.Eisner DA, Caldwell JL, Trafford AW and Hutchings DC. The Control of Diastolic Calcium in the Heart: Basic Mechanisms and Functional Implications. Circulation research. 2020;126:395–412. [DOI] [PMC free article] [PubMed] [Google Scholar]
- 51.Scriven DR and Moore ED. Ca(2)(+) channel and Na(+)/Ca(2)(+) exchange localization in cardiac myocytes. Journal of molecular and cellular cardiology. 2013;58:22–31. [DOI] [PubMed] [Google Scholar]
- 52.Montalvo D, Perez-Trevino P, Madrazo-Aguirre K, Gonzalez-Mondellini FA, Miranda-Roblero HO, Ramonfaur-Gracia D, Jacobo-Antonio M, Mayorga-Luna M, Gomez-Viquez NL, Garcia N and Altamirano J. Underlying mechanism of the contractile dysfunction in atrophied ventricular myocytes from a murine model of hypothyroidism. Cell Calcium. 2018;72:26–38. [DOI] [PubMed] [Google Scholar]
- 53.Dulhunty AF, Gage PW and Lamb GD. Differential effects of thyroid hormone on T-tubules and terminal cisternae in rat muscles: an electrophysiological and morphometric analysis. J Muscle Res Cell Motil. 1986;7:225–36. [DOI] [PubMed] [Google Scholar]
- 54.Lee YK, Ng KM, Chan YC, Lai WH, Au KW, Ho CY, Wong LY, Lau CP, Tse HF and Siu CW. Triiodothyronine promotes cardiac differentiation and maturation of embryonic stem cells via the classical genomic pathway. Mol Endocrinol. 2010;24:1728–36. [DOI] [PMC free article] [PubMed] [Google Scholar]
- 55.Yang X, Rodriguez M, Pabon L, Fischer KA, Reinecke H, Regnier M, Sniadecki NJ, Ruohola-Baker H and Murry CE. Tri-iodo-l-thyronine promotes the maturation of human cardiomyocytes-derived from induced pluripotent stem cells. Journal of molecular and cellular cardiology. 2014;72:296–304. [DOI] [PMC free article] [PubMed] [Google Scholar]
- 56.Scriven DR, Asghari P, Schulson MN and Moore ED. Analysis of Cav1.2 and ryanodine receptor clusters in rat ventricular myocytes. Biophys J. 2010;99:3923–9. [DOI] [PMC free article] [PubMed] [Google Scholar]
- 57.Hou Y, Jayasinghe I, Crossman DJ, Baddeley D and Soeller C. Nanoscale analysis of ryanodine receptor clusters in dyadic couplings of rat cardiac myocytes. Journal of molecular and cellular cardiology. 2015;80:45–55. [DOI] [PubMed] [Google Scholar]
- 58.Shen X, van den Brink J, Hou Y, Colli D, Le C, Kolstad TR, MacQuaide N, Carlson CR, Kekenes-Huskey PM, Edwards AG, Soeller C and Louch WE. 3D dSTORM imaging reveals novel detail of ryanodine receptor localization in rat cardiac myocytes. J Physiol. 2019;597:399–418. [DOI] [PMC free article] [PubMed] [Google Scholar]
- 59.Kolstad TR, van den Brink J, MacQuaide N, Lunde PK, Frisk M, Aronsen JM, Norden ES, Cataliotti A, Sjaastad I, Sejersted OM, Edwards AG, Lines GT and Louch WE. Ryanodine receptor dispersion disrupts Ca(2+) release in failing cardiac myocytes. Elife. 2018;7. [DOI] [PMC free article] [PubMed] [Google Scholar]
- 60.Takeshima H, Komazaki S, Nishi M, Iino M and Kangawa K. Junctophilins: a novel family of junctional membrane complex proteins. Mol Cell. 2000;6:11–22. [DOI] [PubMed] [Google Scholar]
- 61.Hong TT, Smyth JW, Gao D, Chu KY, Vogan JM, Fong TS, Jensen BC, Colecraft HM and Shaw RM. BIN1 localizes the L-type calcium channel to cardiac T-tubules. PLoS Biol. 2010;8:e1000312. [DOI] [PMC free article] [PubMed] [Google Scholar]
- 62.Basheer WA and Shaw RM. Connexin 43 and CaV1.2 Ion Channel Trafficking in Healthy and Diseased Myocardium. Circulation Arrhythmia and electrophysiology. 2016;9:e001357. [DOI] [PMC free article] [PubMed] [Google Scholar]
- 63.Brent GA. Mechanisms of thyroid hormone action. J Clin Invest. 2012;122:3035–43. [DOI] [PMC free article] [PubMed] [Google Scholar]
- 64.Reed TD, Babu GJ, Ji Y, Zilberman A, Ver Heyen M, Wuytack F and Periasamy M. The expression of SR calcium transport ATPase and the Na(+)/Ca(2+) Exchanger are antithetically regulated during mouse cardiac development and in Hypo/hyperthyroidism. Journal of molecular and cellular cardiology. 2000;32:453–64. [DOI] [PubMed] [Google Scholar]
- 65.Boerth SR and Artman M. Thyroid hormone regulates Na(+)-Ca2+ exchanger expression during postnatal maturation and in adult rabbit ventricular myocardium. Cardiovasc Res. 1996;31 Spec No:E145–52. [PubMed] [Google Scholar]
- 66.Cernohorsky J, Kolar F, Pelouch V, Korecky B and Vetter R. Thyroid control of sarcolemmal Na+/Ca2+ exchanger and SR Ca2+-ATPase in developing rat heart. Am J Physiol. 1998;275:H264–73. [DOI] [PubMed] [Google Scholar]
- 67.Scriven DR, Dan P and Moore ED. Distribution of proteins implicated in excitation-contraction coupling in rat ventricular myocytes. Biophys J. 2000;79:2682–91. [DOI] [PMC free article] [PubMed] [Google Scholar]
- 68.Larbig R, Torres N, Bridge JH, Goldhaber JI and Philipson KD. Activation of reverse Na+-Ca2+ exchange by the Na+ current augments the cardiac Ca2+ transient: evidence from NCX knockout mice. J Physiol. 2010;588:3267–76. [DOI] [PMC free article] [PubMed] [Google Scholar]
- 69.Sher AA, Noble PJ, Hinch R, Gavaghan DJ and Noble D. The role of the Na+/Ca2+ exchangers in Ca2+ dynamics in ventricular myocytes. Prog Biophys Mol Biol. 2008;96:377–98. [DOI] [PubMed] [Google Scholar]
- 70.Forini F, Nicolini G, Kusmic C, D’Aurizio R, Rizzo M, Baumgart M, Groth M, Doccini S, Iervasi G and Pitto L. Integrative analysis of differentially expressed genes and miRNAs predicts complex T3-mediated protective circuits in a rat model of cardiac ischemia reperfusion. Sci Rep. 2018;8:13870. [DOI] [PMC free article] [PubMed] [Google Scholar]
- 71.Janssen R, Zuidwijk MJ, Kuster DW, Muller A and Simonides WS. Thyroid Hormone-Regulated Cardiac microRNAs are Predicted to Suppress Pathological Hypertrophic Signaling. Front Endocrinol (Lausanne). 2014;5:171. [DOI] [PMC free article] [PubMed] [Google Scholar]
- 72.Jayasinghe ID, Baddeley D, Kong CH, Wehrens XH, Cannell MB and Soeller C. Nanoscale organization of junctophilin-2 and ryanodine receptors within peripheral couplings of rat ventricular cardiomyocytes. Biophys J. 2012;102:L19–21. [DOI] [PMC free article] [PubMed] [Google Scholar]
- 73.Hu J, Gao C, Wei C, Xue Y, Shao C, Hao Y, Gou LT, Zhou Y, Zhang J, Ren S, Chen J, Wang Y and Fu XD. RBFox2-miR-34a-Jph2 axis contributes to cardiac decompensation during heart failure. Proceedings of the National Academy of Sciences of the United States of America. 2019;116:6172–6180. [DOI] [PMC free article] [PubMed] [Google Scholar]
- 74.Zhang HB, Li RC, Xu M, Xu SM, Lai YS, Wu HD, Xie XJ, Gao W, Ye H, Zhang YY, Meng X and Wang SQ. Ultrastructural uncoupling between T-tubules and sarcoplasmic reticulum in human heart failure. Cardiovasc Res. 2013;98:269–76. [DOI] [PubMed] [Google Scholar]
- 75.Gross P, Johnson J, Romero CM, Eaton DM, Poulet C, Sanchez-Alonso J, Lucarelli C, Ross J, Gibb AA, Garbincius JF, Lambert J, Varol E, Yang Y, Wallner M, Feldsott EA, Kubo H, Berretta RM, Yu D, Rizzo V, Elrod J, Sabri A, Gorelik J, Chen X and Houser SR. Interaction of the Joining Region in Junctophilin-2 With the L-Type Ca(2+) Channel Is Pivotal for Cardiac Dyad Assembly and Intracellular Ca(2+) Dynamics. Circulation research. 2021;128:92–114. [DOI] [PMC free article] [PubMed] [Google Scholar]
- 76.Guo A, Wang Y, Chen B, Wang Y, Yuan J, Zhang L, Hall D, Wu J, Shi Y, Zhu Q, Chen C, Thiel WH, Zhan X, Weiss RM, Zhan F, Musselman CA, Pufall M, Zhu W, Au KF, Hong J, Anderson ME, Grueter CE and Song LS. E-C coupling structural protein junctophilin-2 encodes a stress-adaptive transcription regulator. Science. 2018;362. [DOI] [PMC free article] [PubMed] [Google Scholar]
- 77.Cheah JX, Nieuwenhuis TO and Halushka MK. An expanded proteome of cardiac t-tubules. Cardiovascular pathology : the official journal of the Society for Cardiovascular Pathology. 2019;42:15–20. [DOI] [PMC free article] [PubMed] [Google Scholar]
- 78.Veeraraghavan R and Gourdie RG. Stochastic optical reconstruction microscopy-based relative localization analysis (STORM-RLA) for quantitative nanoscale assessment of spatial protein organization. Mol Biol Cell. 2016;27:3583–3590. [DOI] [PMC free article] [PubMed] [Google Scholar]
Associated Data
This section collects any data citations, data availability statements, or supplementary materials included in this article.