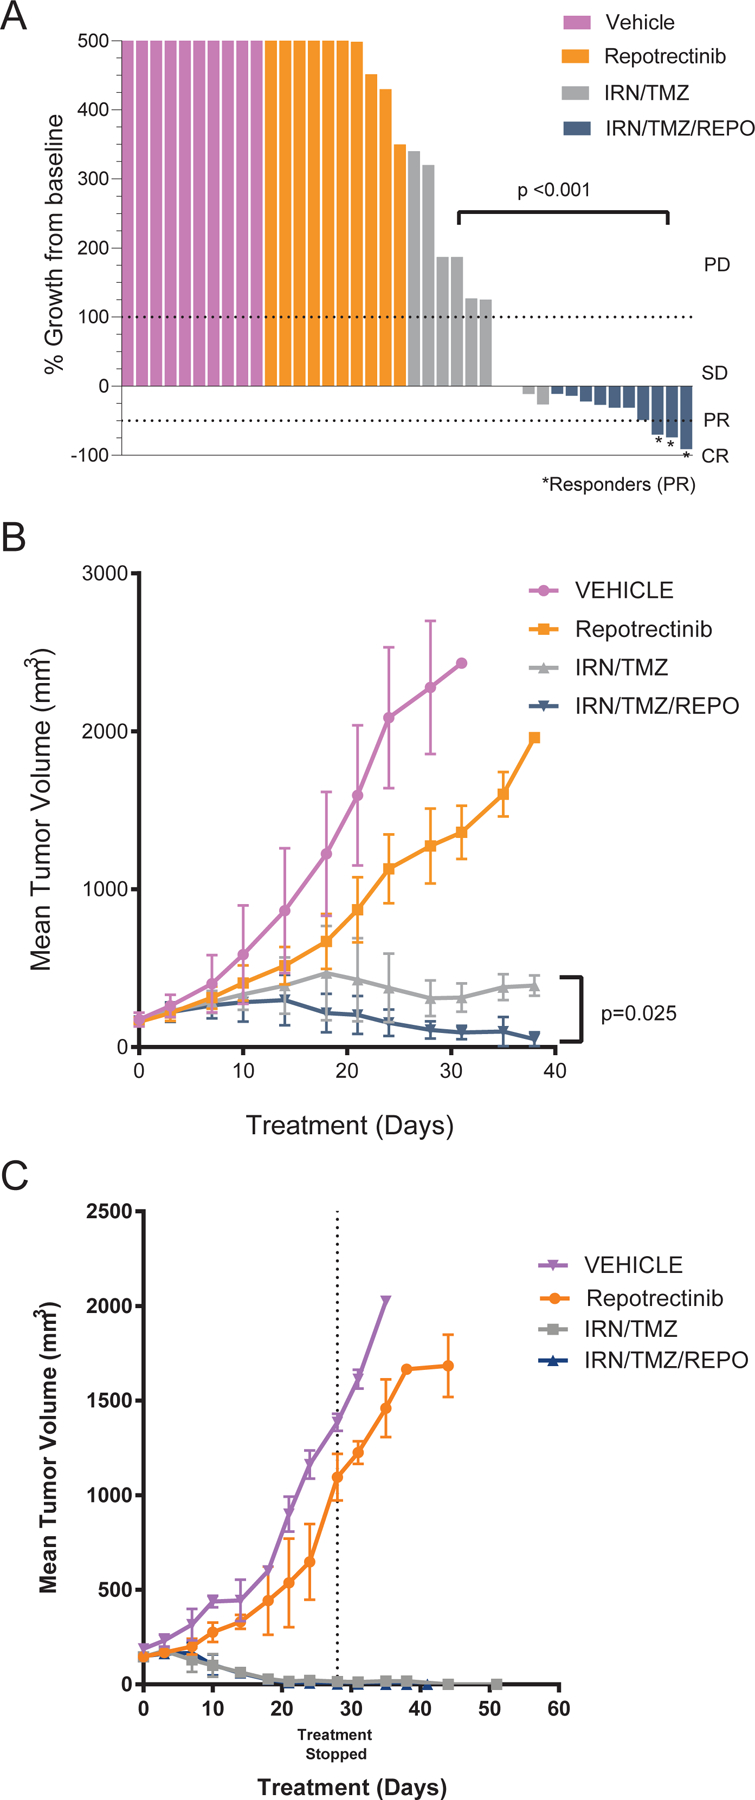
Figure 4: Repotrectinib Plus Chemotherapy In Vivo Therapeutic Drug Studies.

(A) Waterfall plot of best response after 2 cycles of therapy (MSKNBL-30595, ALK 1174V, MYCN amp, TERT promoter mutation); Tumor volume increase beyond 500% not shown here; (B) Mean tumor volume of MSKNBL-30595 in combination therapy study (n=10 mice per arm); Treatment ongoing throughout study interval. (C) Mean tumor volume of MSKNBL-82180 (ALK WT, MYCN WT, ATRX mutation n=3 mice per arm, exception: IRN/TMZ n=4); IRN=irinotecan; TMZ=temozolomide; REPO=repotrectinib.
