
Figure 3: Margin and WhatsHap phasing results.
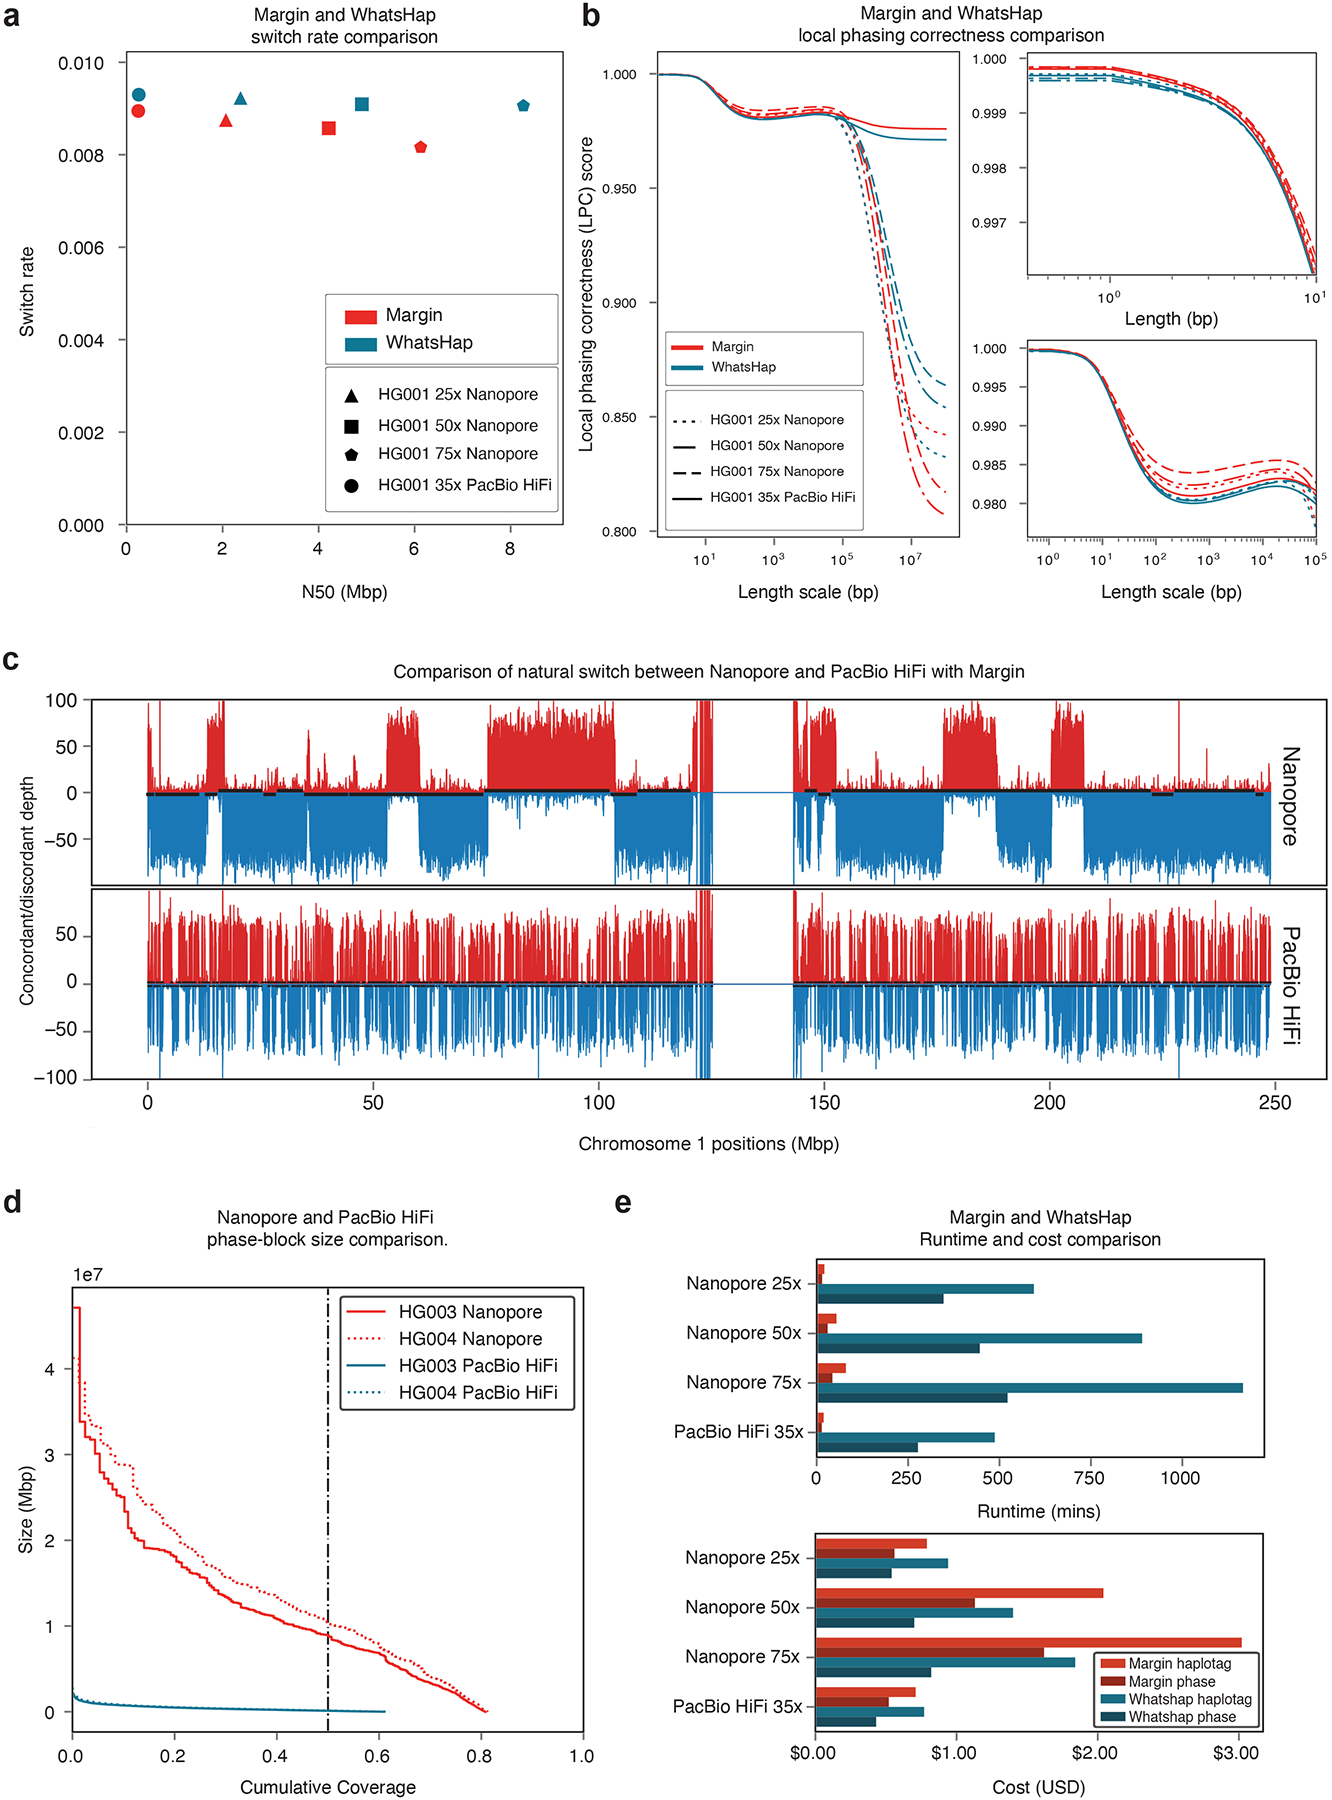
(a) Phaseset switch rate to N50. (b) Novel metric “Local Phasing Correctness” analyzing phaseset accuracy across different length scales. For visibility, we plot the full data (left), short length scales (right top), and medium length scales (right bottom). (c) Novel visualization “Natural Switch Rate” describing haplotagging accuracy for reads. Phasing is consistent across the top/red and bottom/blue blocks, with switch errors occurring at the transitions between these. (d) Phaseset N50 for Nanopore and PacBio HiFi data on HG003 and HG004. (e) Cost and runtime comparison between Margin and Whatshap. Plots (a) and (b) are generated from phased HG001 GIAB v3.3.2 variants; plot (c) is generated from an admixture of reads from HG005 and HG02723.