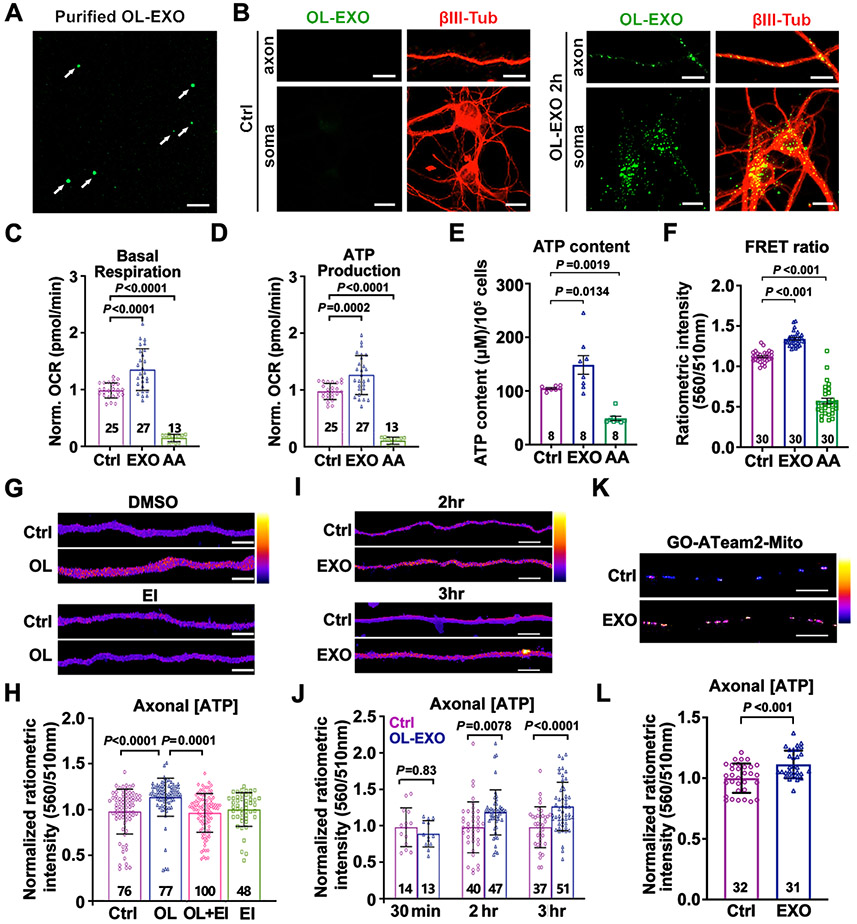
Figure 2. OL-EXOs Are Internalized into Neurons and Enhance Axonal Mitochondrial Energetics.
(A, B) Imaging of ExoGlow-labeled OL-EXOs (arrows, A) and their uptake by cultured neurons (B). ExoGlow-OL-EXOs (green) were incubated with cortical neurons at DIV8 for 2 hours, followed by immunostaining of βIII-tubulin (red).
(C, D) Neurons treated with OL-EXOs exhibit increased basal respiration (C) and ATP production (D). As a negative control, mitochondrial respiration was blocked by AA (100 nM, 24 hours).
(E, F) Analyses of ATP content (E, μM/105 cells) using luciferase-based assay and FRET-based ATP sensor (F) in DIV8 neurons cultured with OL-EXOs for 24 hours.
(G, H) Heatmap images (G) and quantification (H) of normalized axonal ATP levels in DIV8 axons cultured alone (Ctrl), co-cultured with OLs, co-cultured with OLs in the presence of exosome inhibitor GW4869 (EI, 1 μM) (OL+EI), or cultured in the presence of EI alone.
(I, J) Heatmap images (I) and quantification (J) of normalized axonal ATP levels in DIV8 axons treated with control media (Ctrl) or purified OL-EXOs (EXO) for the time indicated. Data were collected from five biological replicates.
(K, L) Images (K) and quantification (L) of mitochondrial ATP levels within the inner mitochondrial matrix using mitochondria-targeted ATP sensor GO-ATeam2-Mito. DIV8 neuronal axons were incubated with OL-EXOs for 24 hours.
Data were quantified from the total number of neuronal wells (C-E) or the total number of neuron (F) or axon images (H, J, L) indicated within or above bars from more than three biological replicates and expressed as mean ± SD. Statistical analyses were performed using a one-way ANOVA test with Tukey’s multiple comparisons test (C, D, H) or Dunnett’s multiple comparisons test (E, F), a two-way ANOVA test with Sidak’s multiple comparisons test (J), or an unpaired Student’s t-test (L). Scale bars, 10 μm (A, B, K), 5 μm (G, I).
See also Figures S3 and S4.

