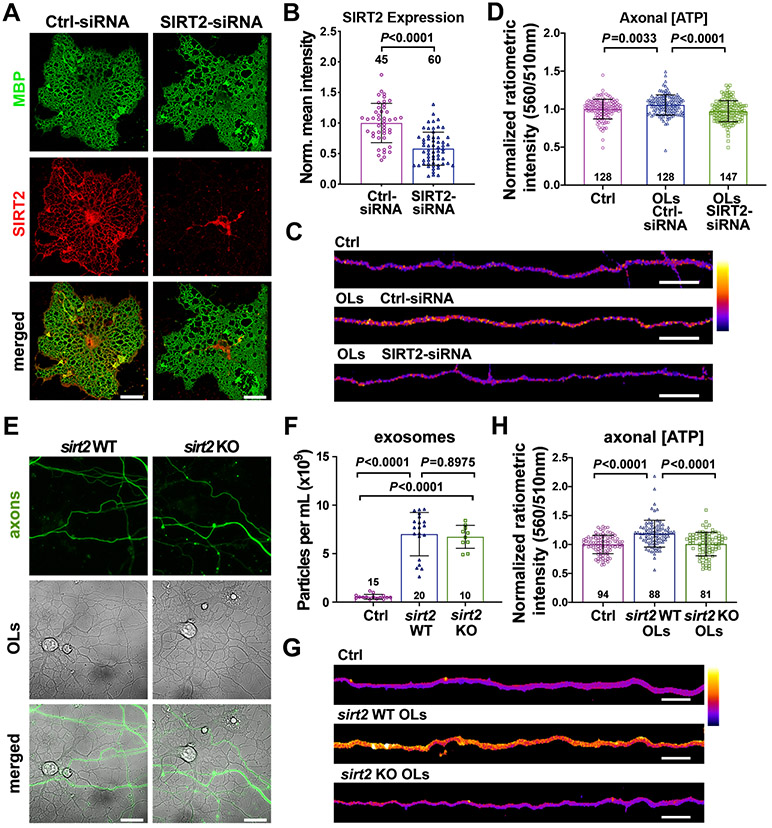
Figure 5. SIRT2-Deficient OLs Abrogates Axonal ATP Increase.
(A, B) Images (A) and quantification (B) showing relative SIRT2 expression in DIV4 OLs transfected with Ctrl-siRNA or SIRT2-siRNA for 72 hours. Intensity of SIRT2 immunolabeling (red) was normalized to MBP (green).
(C, D) Heatmap images (C) and quantification (D) of normalized ATP levels from DIV7-8 axons cultured alone (Ctrl), co-cultured with OLs transfected with Ctrl-siRNA or SIRT2-siRNA.
(E) Representative DIC images demonstrating that sirt2 WT and KO OLs are morphologically similar, grow extensively in the axonal compartment, and make contacts with axons (green).
(F) Particles per milliliter (ml) detected during Nanosight tracking analysis (NTA) of exosomes purified from WT and sirt2 KO OLs cultured at the same density. Note that OLs release similar exosomes per ml regardless of sirt2 deletion.
(G, H) Heatmap images (G) and quantification (H) of normalized ATP levels from DIV7-10 axons cultured alone (Ctrl), co-cultured with WT or sirt2 KO OLs.
Data were quantified from the total number of cells (B), axons (D, H), or Nanosight recordings (F) indicated in or above bars from two (B) or three (D, F, H) biological replicates and expressed as mean ± SD. Statistical analyses were performed using an unpaired Student’s t-test (B) or a one-way ANOVA test with Tukey’s multiple comparisons test (D, F, H). Scale bars, 20 μm (A), 10 μm (C), 25 μm (E), 5 μm (G).
See also Figure S5.

