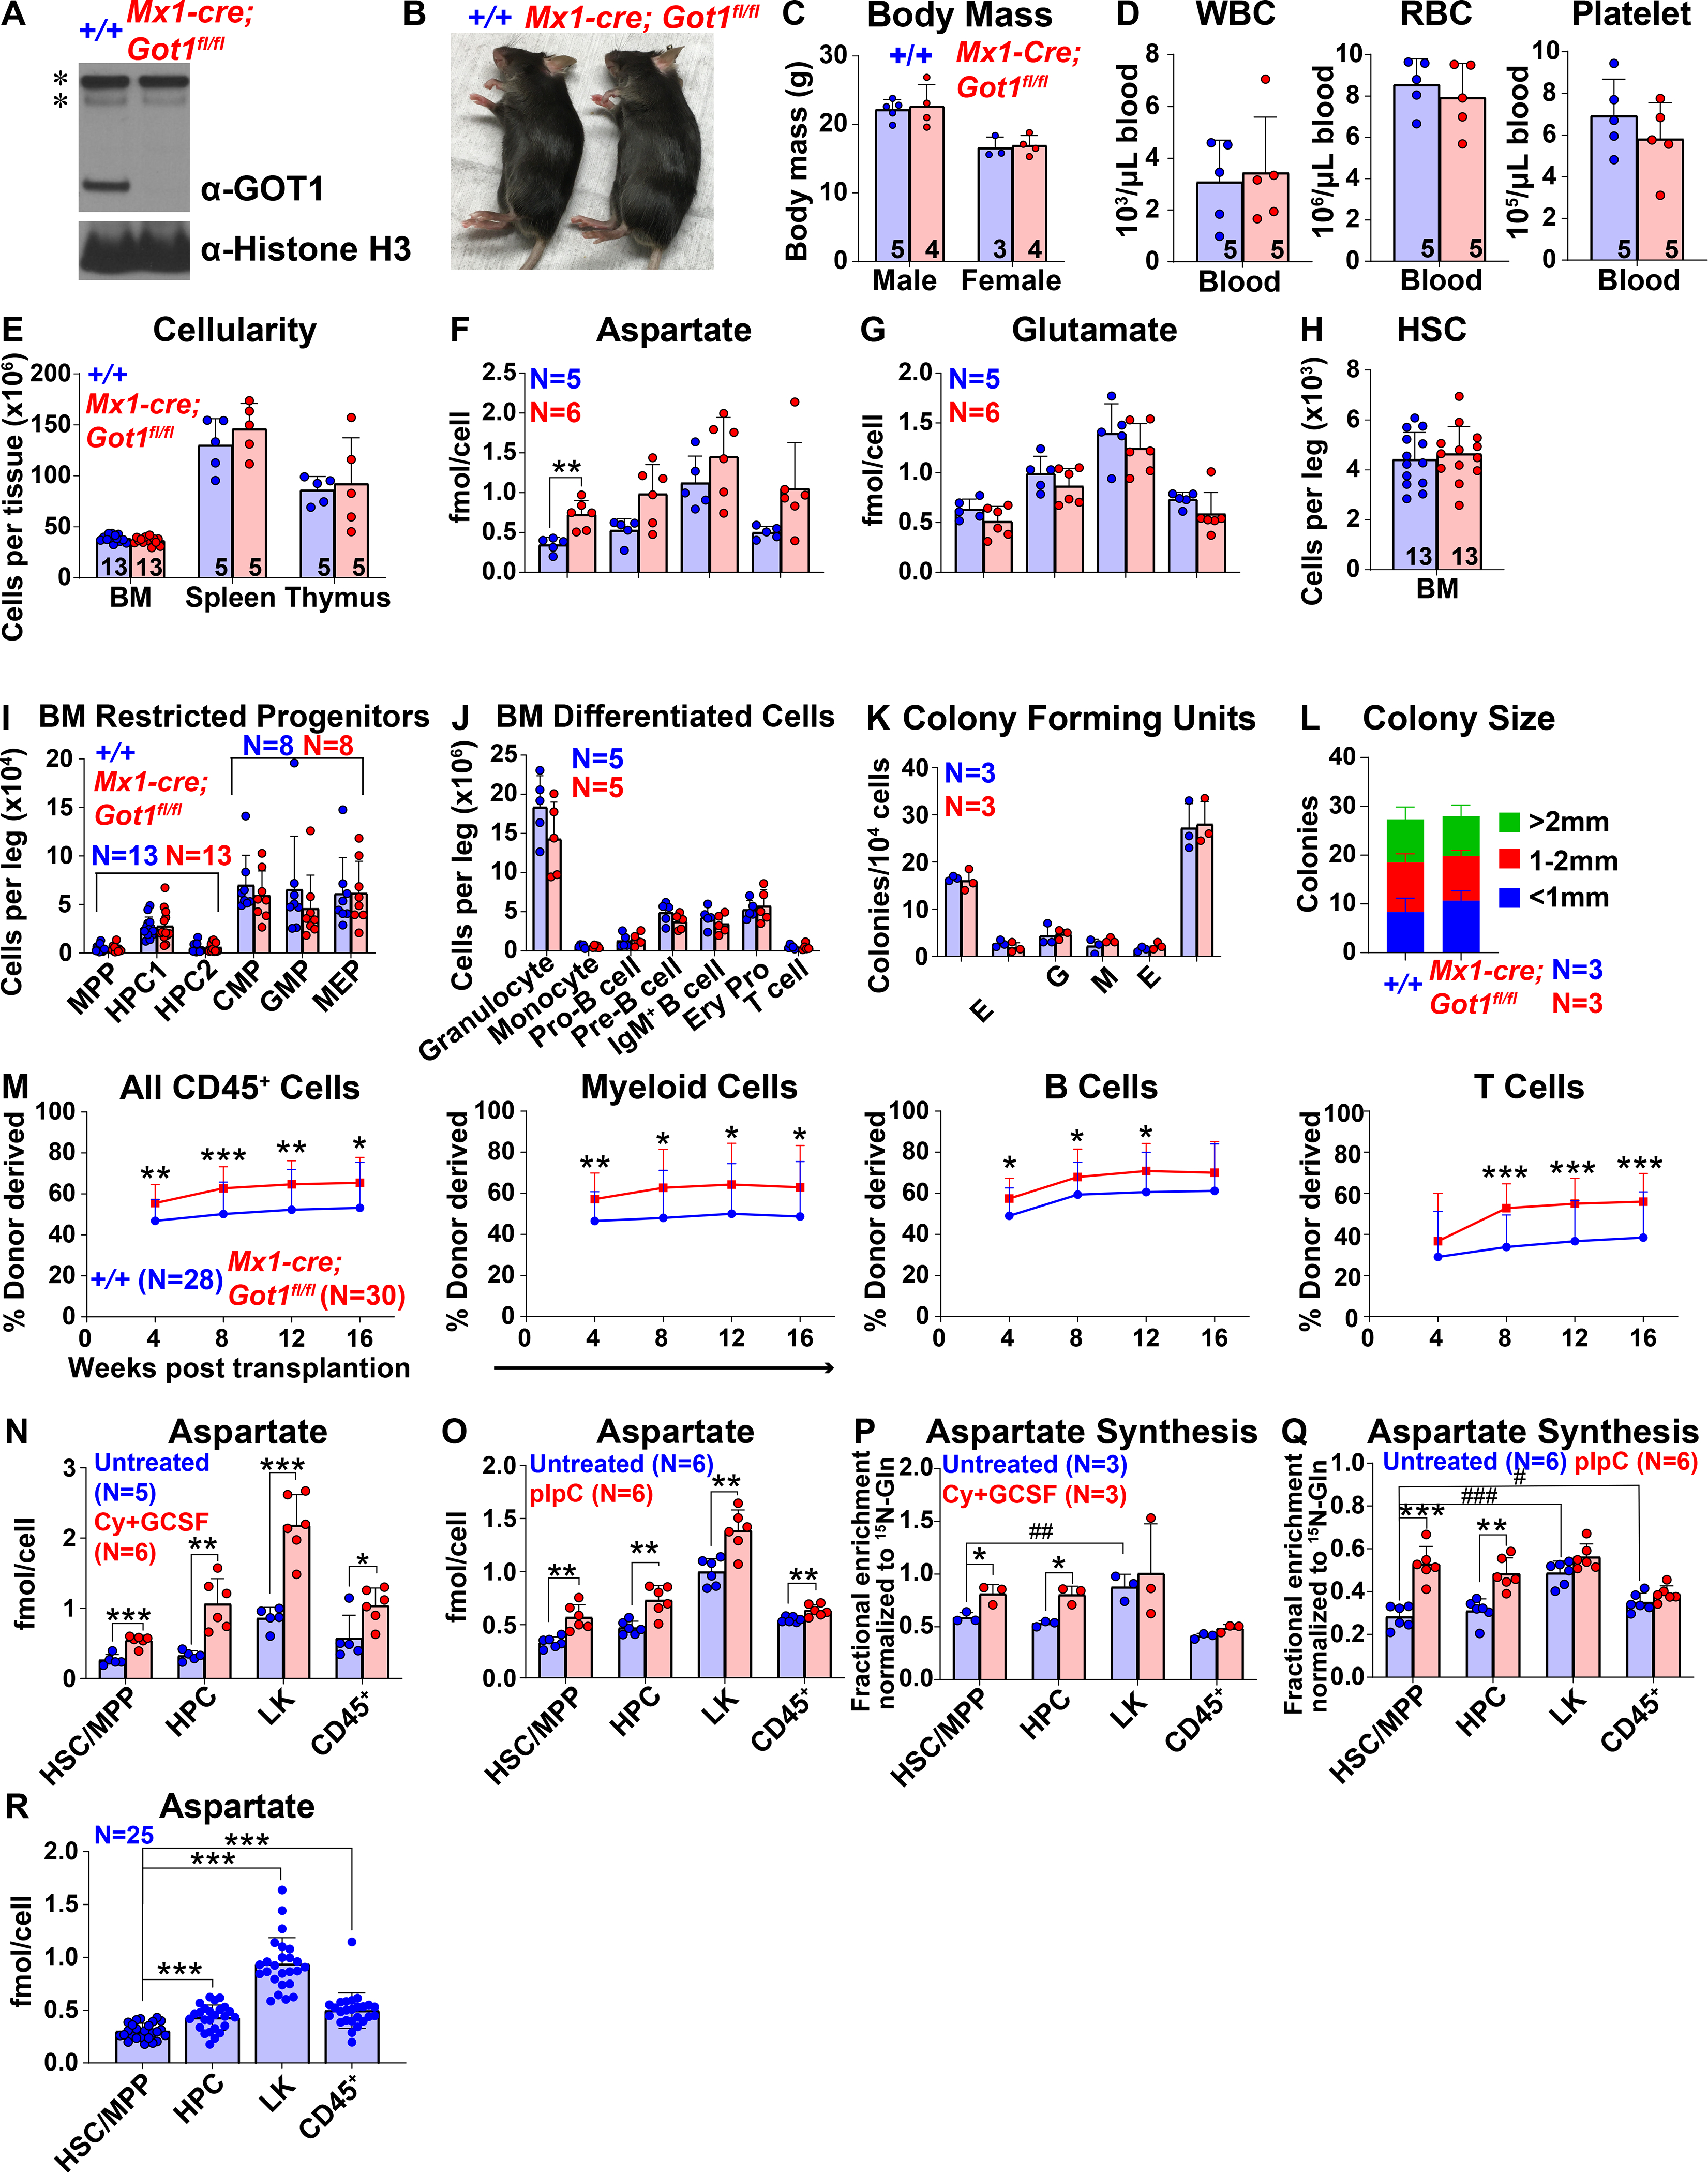
Figure 2. Got1 deficiency increases aspartate levels and HSC function.

(A) Western blots with antibodies against GOT1 and Histone H3 were performed using bone marrow cells from Mx1-cre; Got1fl/fl and control mice (* denotes nonspecific bands). (B and C) Mx1-cre; Got1fl/fl and control mice did not differ in size or appearance. (D) White blood cell, red blood cell, and platelet counts in the blood of Mx1-cre; Got1fl/fl and control mice. (E) Cellularity of the bone marrow from one femur and one tibia, the spleen, and the thymus. (F and G) Aspartate (F) and glutamate (G) levels in HSCs/MPPs, HPCs, LK cells, and CD45+ cells from Mx1-cre; Got1fl/fl and control bone marrow. (H-J) Numbers of HSCs (H), restricted progenitors (I), and differentiated cells (J) in the bone marrow from one femur and one tibia. (K and L) Numbers and sizes of colonies formed by 10,000 bone marrow cells. (M) Donor-derived CD45+, myeloid, B, and T cells in the blood of mice competitively transplanted with Mx1-cre; Got1fl/fl or control bone marrow cells (n=28–30 recipient mice total from 6 independent experiments with 6 donors per genotype). (N and O) Aspartate levels in HSCs/MPPs, HPCs, LK cells, and CD45+ cells from cyclophosphamide/G-CSF (N) or pIpC (O) treated versus untreated control bone marrow. (P and Q) In vivo isotope tracing in hematopoietic stem and progenitor cell populations isolated from cyclophosphamide/G-CSF (P) or pIpC (Q) treated as compared to untreated control mice infused with 15N-glutamine: fractional enrichment of 15N-aspartate normalized to 15N-glutamine. (R) Aspartate levels in HSCs/MPPs, HPCs, LK cells, and CD45+ cells: data was pooled from Figures 1M, 2F, 2N and 2O. All data represent mean ± standard deviation (* P< 0.05; ** P<0.01; *** P<0.001). The number of mice analyzed per genotype is shown in each panel. See also Figure S2, Tables S1 and S2.
