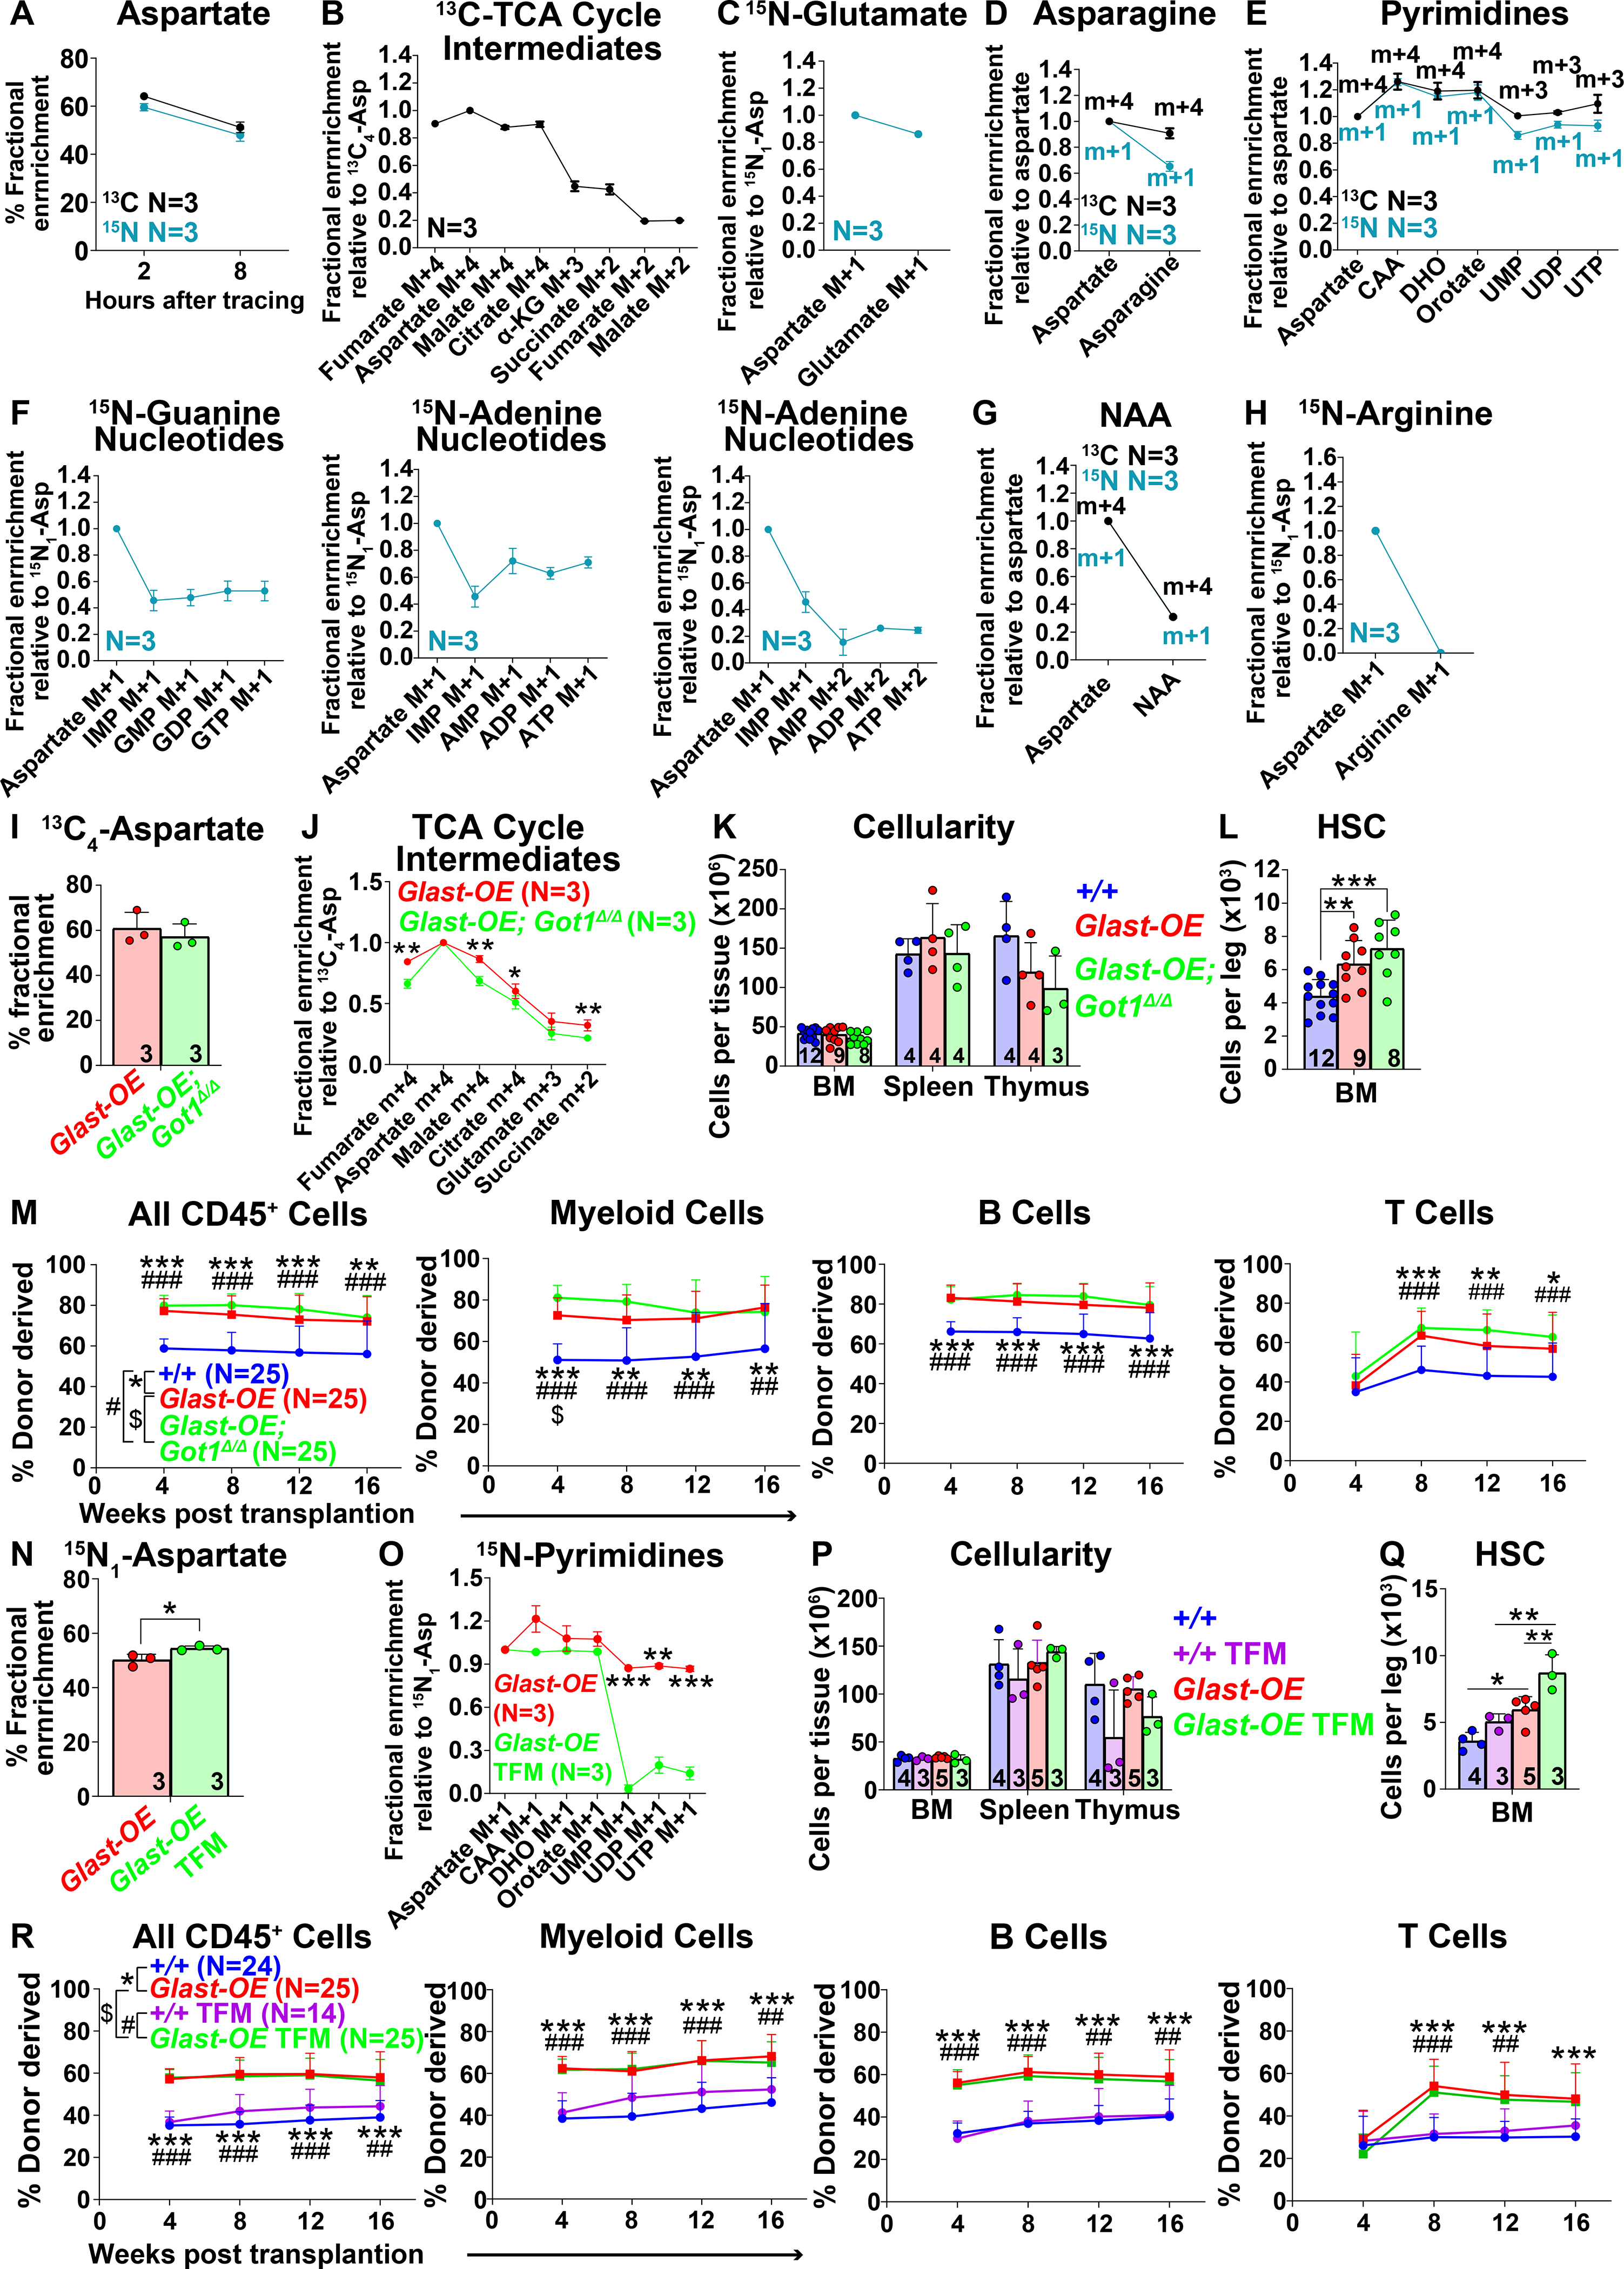
Figure 4. Tracing of isotopically labelled aspartate in hematopoietic stem/progenitor cells.

(A-G) Isotope tracing in GLAST over-expressing hematopoietic stem/progenitor cells cultured with 200μM universally 13C (black) or 15N (blue) labelled aspartate. Fractional enrichment of aspartate (A), TCA cycle intermediates (B), glutamate (C), asparagine (D), pyrimidines (E), purines (F), NAA (G) and arginine (H). The fractional enrichment of arginine (H) was measured in cells cultured in arginine-free medium. The natural abundance of isotopes was corrected using the AccuCor method (Su et al., 2017). The fractional enrichment was shown at 2 hours after adding labelled aspartate to culture for TCA cycle intermediates (B) and glutamate (C), and after 8 hours for the other pathways (D-H). (α-KG: α-ketoglutarate, CAA: carbamoyl aspartic acid, DHO: dihydroorotate). (I and J) Fractional enrichment of aspartate (I) and TCA cycle intermediates (J) in hematopoietic stem/progenitor cells cultured from Vav1-cre; Rosa26LSL-GIast (Glast-OE) or Vav1-cre; Rosa26LSL-Glast; Got1fl/fl (Glast-OE; Got1Δ/Δ) mice and supplemented with universally 13C-labelled aspartate for 2 hours. (K) Cellularity of the bone marrow from one femur and one tibia, the spleen, and the thymus. (L) Number of HSCs in the bone marrow from one femur and one tibia. (M) Donor-derived CD45+, myeloid, B, and T cells in the blood of mice competitively transplanted with Glast-OE; Got1Δ/Δ, Glast-OE, or control donor bone marrow cells (n=25 recipient mice total from 5 independent experiments with 5 donors per genotype). (N and O) Fractional enrichment of aspartate (N) and pyrimidine synthesis intermediates (O) in Glast-OE stem/progenitor cells cultured with 15N-labelled aspartate for 8 hours, with or without teriflunomide (TFM). (P) Cellularity of the bone marrow from one femur and one tibia, the spleen, and the thymus from Glast-OE or wild-type control mice treated with vehicle or TFM. (Q) Number of HSCs in the bone marrow from one femur and one tibia. (R) Donor-derived CD45+, myeloid, B, and T cells in the blood of mice competitively transplanted with Glast-OE or control donor bone marrow cells, and with or without TFM treatment of the recipient mice (n=14–25 recipient mice total from 5 independent experiments with 3–5 donors per condition). All data represent mean ± standard deviation (* P< 0.05; ** P<0.01; *** P<0.001). The number of mice analyzed per genotype is in each panel. See also Figure S4 and Table S1.
