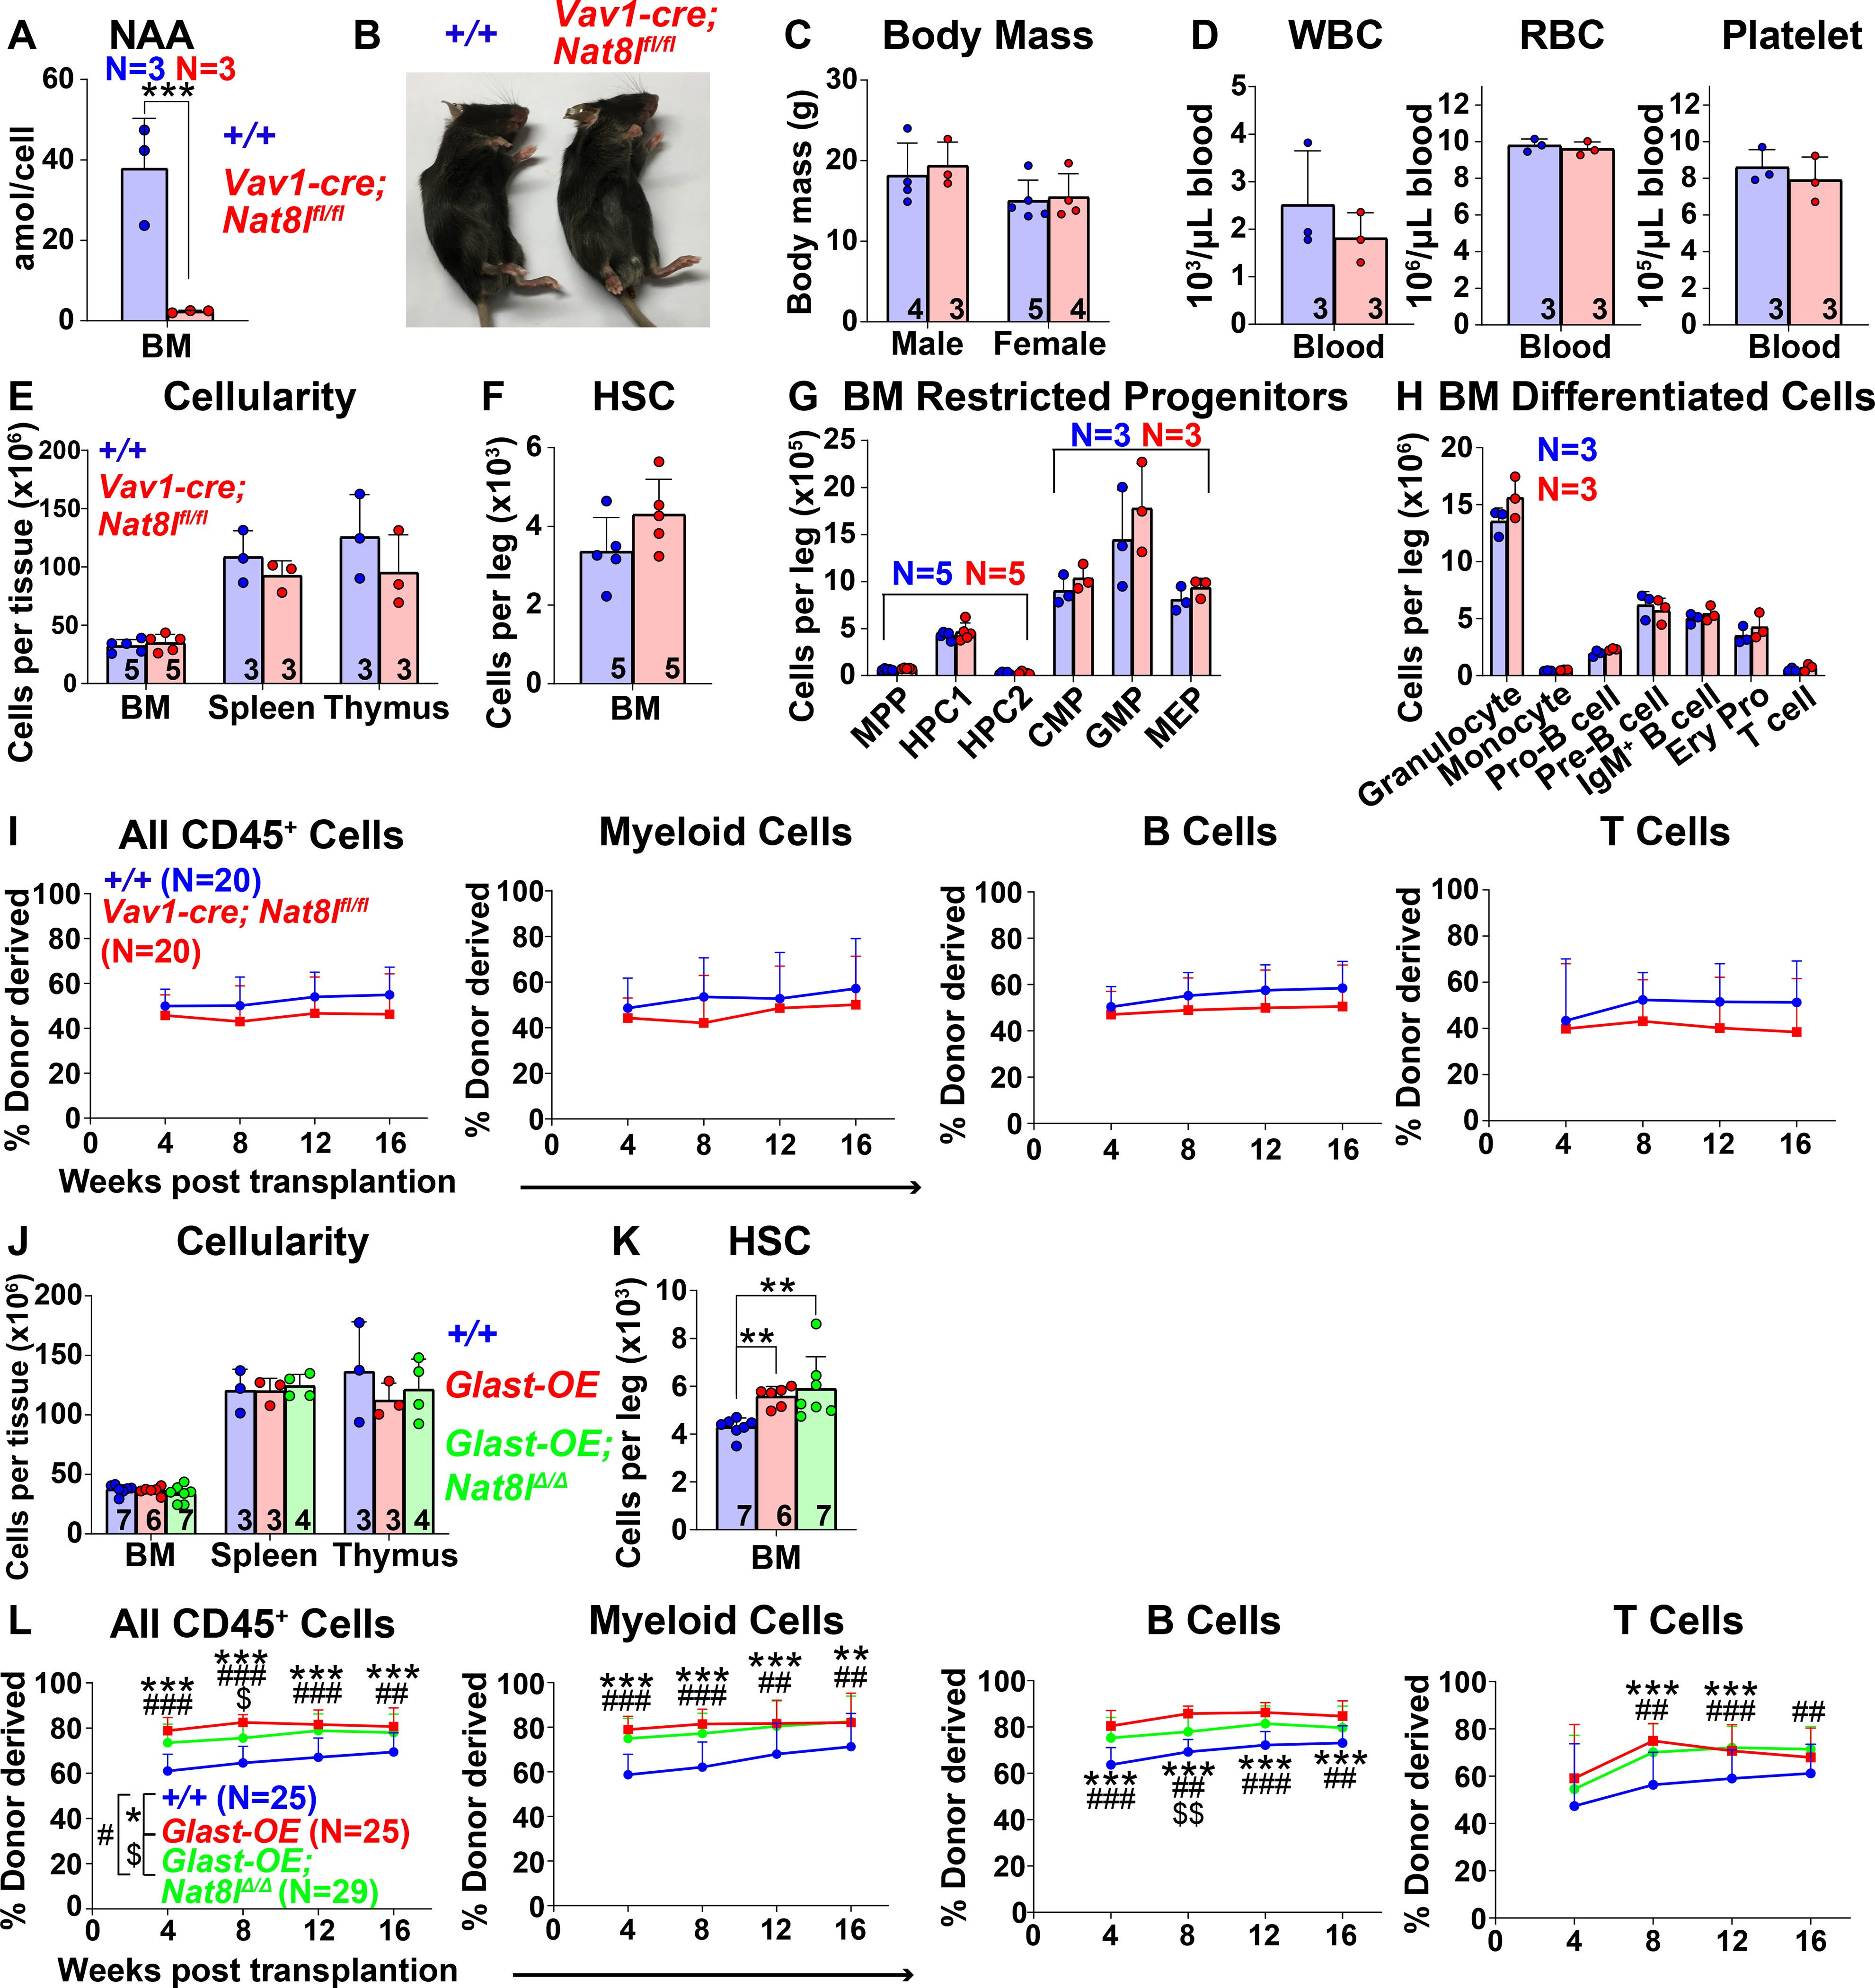
Figure 5. N-acetylaspartate (NAA) synthesis does not mediate the effects of GLAST over-expression on HSC function.

(A) NAA was severely depleted in bone marrow cells from Vav1-cre; Nat8lfl/fl mice. (B and C) Vav1-cre; Nat8lfl/fl and control mice did not differ in size or appearance. (D) White blood cell, red blood cell, and platelet counts in Vav1-cre; Nat8lfl/fl and control blood. (E) Cellularity of the bone marrow from one femur and one tibia, the spleen, and the thymus. (F-H) Numbers of HSCs (F), restricted progenitors (G), and differentiated hematopoietic cells (H) in the bone marrow from one femur and one tibia. (I) Donor-derived CD45+, myeloid, B, and T cells in the blood of mice competitively transplanted with Vav1-cre; Nat8lfl/fl or control bone marrow cells (n=20 recipient mice total from 4 independent experiments using 4 donors per genotype). (J) Cellularity of the bone marrow from one femur and one tibia, the spleen, and the thymus of Vav1-cre; Rosa26LSL-Glast (Glast-OE), Vav1-cre; Rosa26LSL-Glast; Nat8lfl/fl (Glast-OE; Nat8lΔ/Δ), and control mice. (K) Number of HSCs in the bone marrow from one femur and one tibia. (L) Donor-derived CD45+, myeloid, B, and T cells in the blood of mice competitively transplanted with Glast-OE; Nat8lΔ/Δ; Glast-OE or control bone marrow cells (n=25–29 recipient mice total from 5 independent experiments with 5–6 donors per genotype). All data represent mean ± standard deviation (* P< 0.05; ** P<0.01; *** P<0.001). The number of mice analyzed per genotype is shown in each panel. See also Figure S5 and Table S1.
