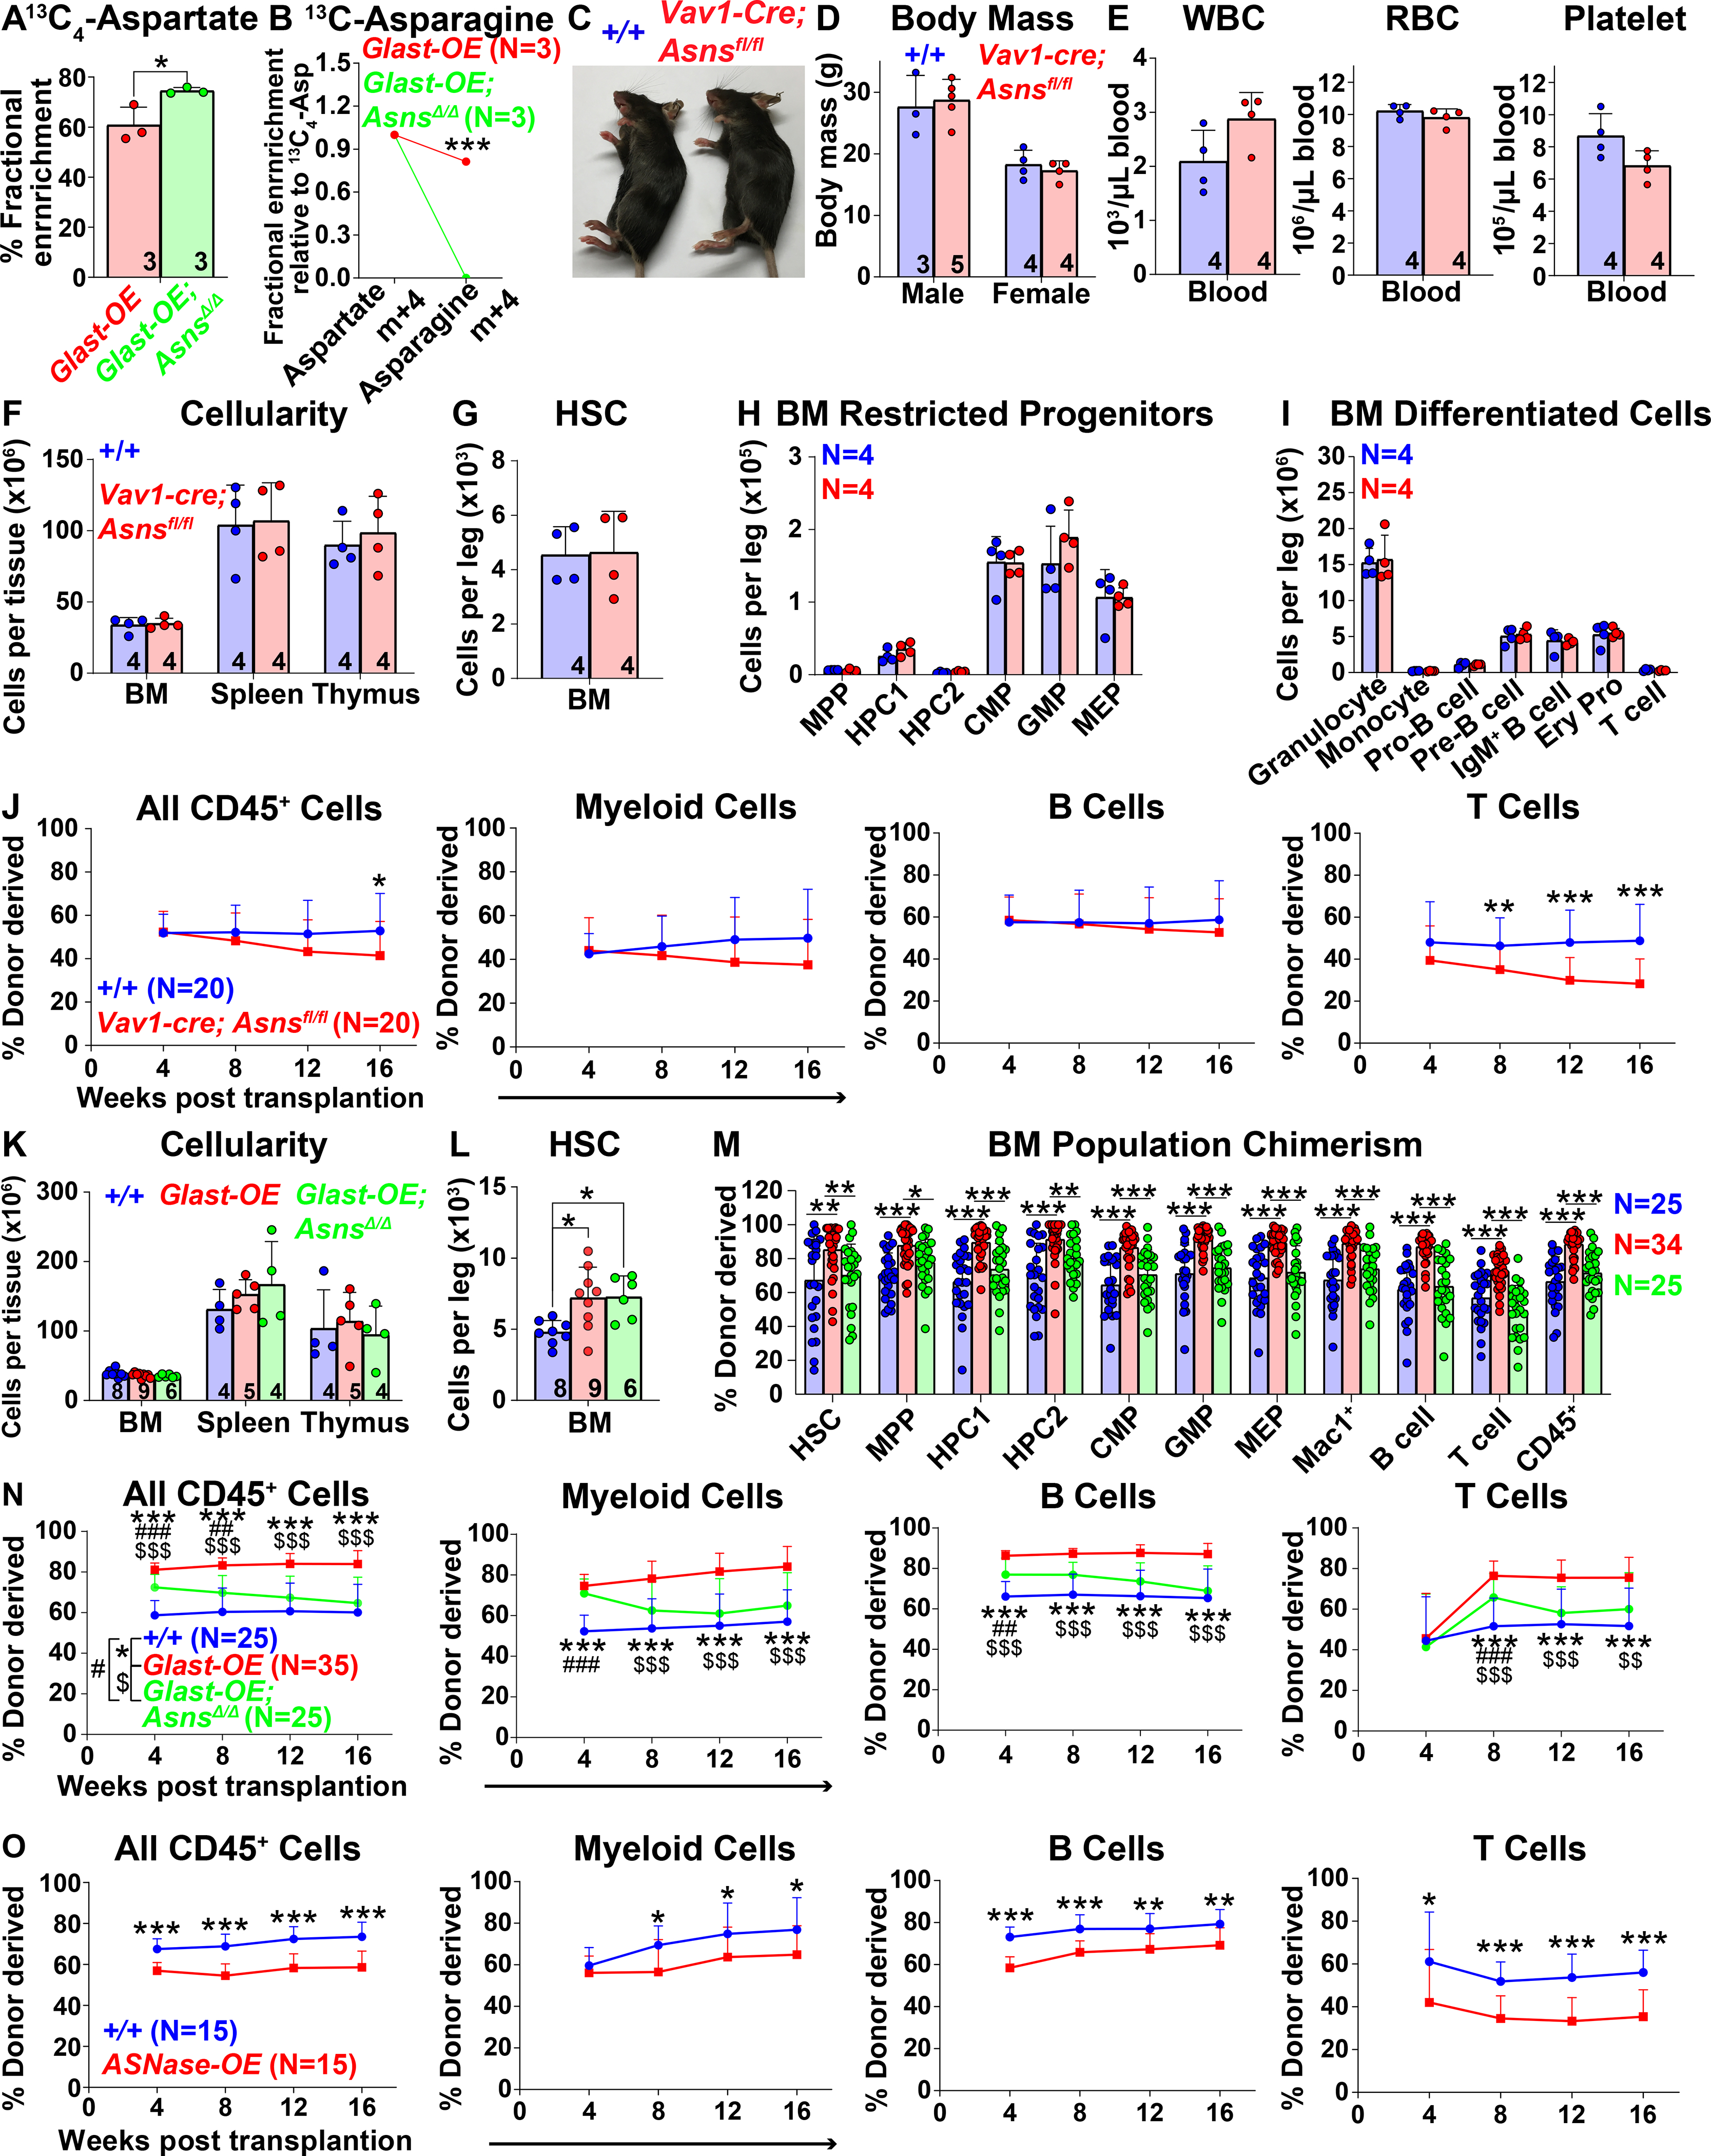
Figure 6. Asparagine synthesis contributes to the effects of GLAST on HSC function.

(A and B) Isotope tracing in hematopoietic stem/progenitor cells from Vav1-cre; Rosa26LSL-Glast (Glast-OE) or Vav1-cre; Rosa26LSL-Glast; Asnsfl/fl (Glast-OE; AsnsΔ/Δ) mice cultured with [U-13C] (m+4)-labelled aspartate. Fractional enrichment of aspartate (A), and asparagine (B). These data are from the same experiment as in Figures 4I and 4J. (C and D) Vav1-cre; Asnsfl/fl and control mice did not differ in size or appearance. (E) White blood cell, red blood cell, and platelet counts in the blood of Vav1-cre; Asnsfl/fl and control mice. (F) Cellularity of the bone marrow from one femur and one tibia, the spleen, and the thymus. (G-I) Number of HSCs (G), restricted progenitors (H) and differentiated hematopoietic cells (I) in the bone marrow from one femur and one tibia. (J) Donor-derived CD45+, myeloid, B, and T cells in the blood of mice competitively transplanted with Vav1-cre; Asnsfl/fl or control bone marrow cells (n=20 recipient mice total from 4 donors per genotype in 4 independent experiments). (K) Cellularity of the bone marrow from one femur and one tibia, the spleen, and the thymus of Glast-OE, Glast-OE; AsnsΔ/Δ and control mice. (L) Number of HSCs in the bone marrow from one femur and one tibia. (M and N) Donor-derived HSCs and restricted hematopoietic progenitors in the bone marrow (M) as well as CD45+, myeloid, B, and T cells in the blood (N) of mice competitively transplanted with Glast-OE; Asns Δ/Δ, Glast-OE, and control bone marrow cells (n=25–35 recipient mice total from 5–7 donors per genotype in 5 independent experiments). (O) Donor-derived CD45+, myeloid, B, and T cells in the blood of mice competitively transplanted with Vav1-cre; Rosa26LSL-gpASNase1 (ASNase-OE) or control donor bone marrow cells (n=15 recipient mice total from 3 donors per genotype in 3 independent experiments). All data represent mean ± standard deviation (* P< 0.05; ** P<0.01; *** P<0.001). The number of mice analyzed per genotype is in each panel. See also Figure S6 and Table S1.
