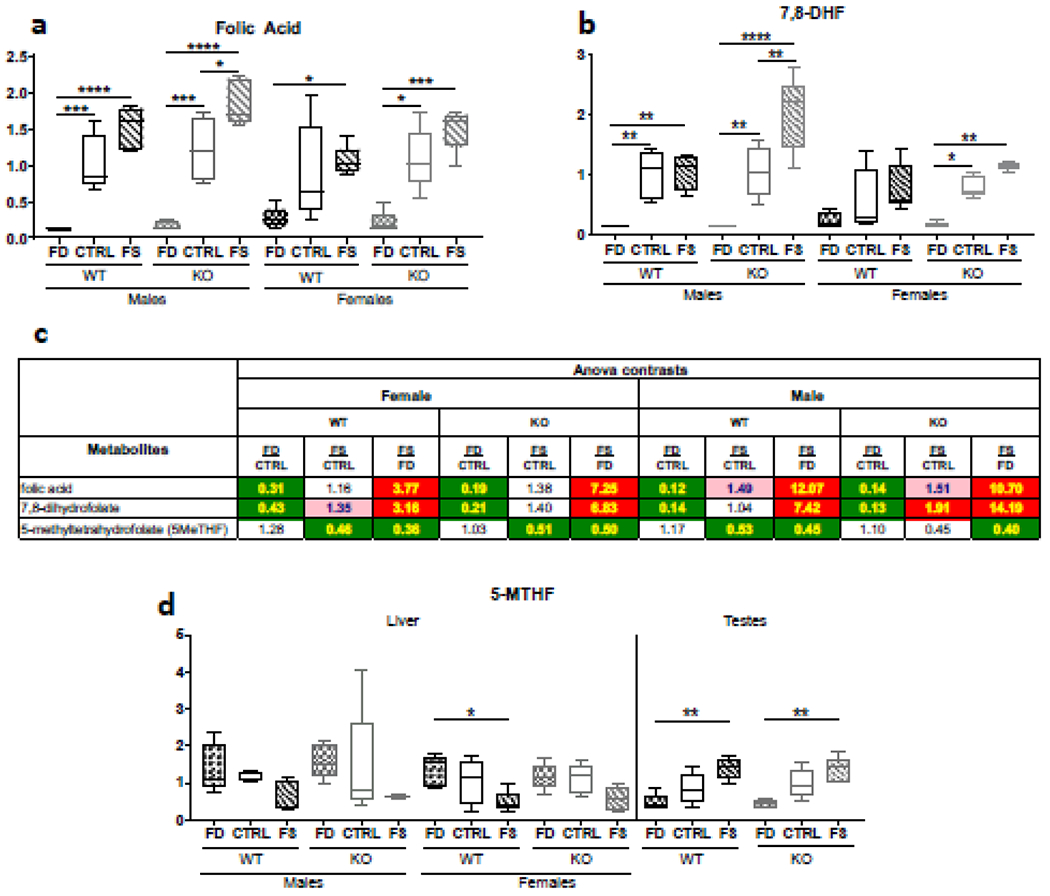
Figure 1.

Alteration of dietary folic acid supplementation differentially affects the concentrations of liver folate derivatives. Tissue folic acid (a), 7,8-dihydrofolic acid (b) and 5-methyl-THF (c) demonstrate distinct dose responses. Fold changes of each metabolite for different comparison groups can be seen in panel (d). Metabolon® measurements presented as box plots showing minimum and maximum values were plotted using Prism software, n=5. Checkered bars, FD diet; solid bars, Control diet; striped bars, FS diet. WT shown in black and KO shown in grey. *, p<0.05; **, p<0.01; ***, p<0.001; ****, p<0.0001, determined by One-way ANOVA with Sidak’s multiple comparisons test.
